Any stellar SEO strategy should be meticulously tracked and heavily data-driven.
Gut feel is great when deciding on which new pair of shoes to buy, but it’s not the best foundation to base your SEO work upon.
Google Analytics is a treasure trove of insightful data. And it’s free! However, with so much data available at our fingertips, it can be a bit of a minefield, and most people only scratch the surface.
Keyword rankings are great for stroking your ego and making your client smile and nod, but they don’t tap into the bigger picture.
In order to continually build on and improve your campaign, you need to pay close attention to the nitty-gritty of your data. There’s a lot to take into account, but in this post we’ll provide an overview of the key Google Analytics reports and views to bolster your SEO campaigns.
Many of these reports can be created as custom reports, which is handy for tailoring your reporting to specific business needs and sharing with clients.
Read on and we’ll help you to track and measure your SEO efforts like the analytical guru you are.
1. Organic search
Where to find it: ‘Acquisition’ > ‘Overview’ > Click through to ‘Organic Search’
It’s an obvious one but a good place to start. Head to the ‘Overview’ tab under ‘Acquisition’ for a base level indication of your website’s primary traffic channels. This provides an immediate summary of your top channels and how each is performing in terms of traffic volume, behavior and conversions.
As well as showing a general overview of organic traffic, you can also dig deeper into the data by clicking on ‘Organic Search’ in the table and playing around with the filters. Consider the most popular organic landing pages, an overview of keywords, search engines sending the most traffic, exit pages, bounce rates, and more.
On the topic of bounce rates, it’s a good idea to pay particular attention to this metric with regards to individual pages. Identify those pages with a bounce rate that is below the average for your site. Take some time to review these pages and work out why that might be, subsequently applying any UX/UI or targeting amendments.
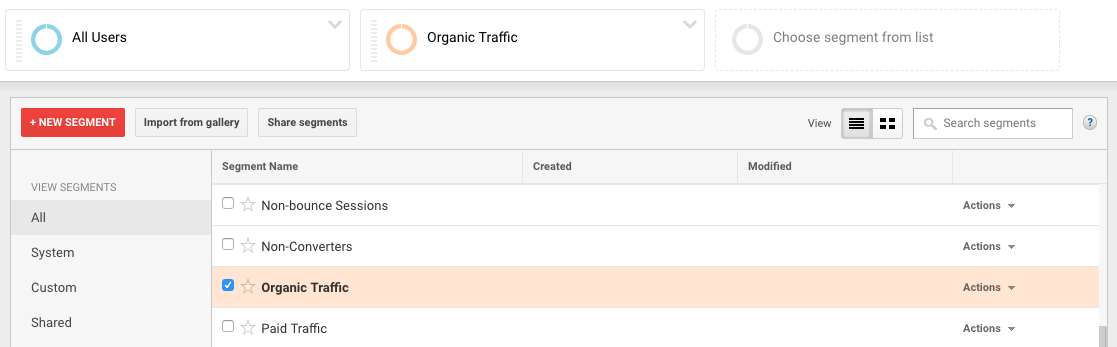
This is all very well but wouldn’t it be handy if you could view only your organic traffic across the whole of your Google Analytics? It’s easier than you think. Simply click to ‘Add Segment’ and check the box for organic traffic.
Leave the ‘All Users’ segment for a handy comparison, or remove this segment for a view of only your organic traffic.

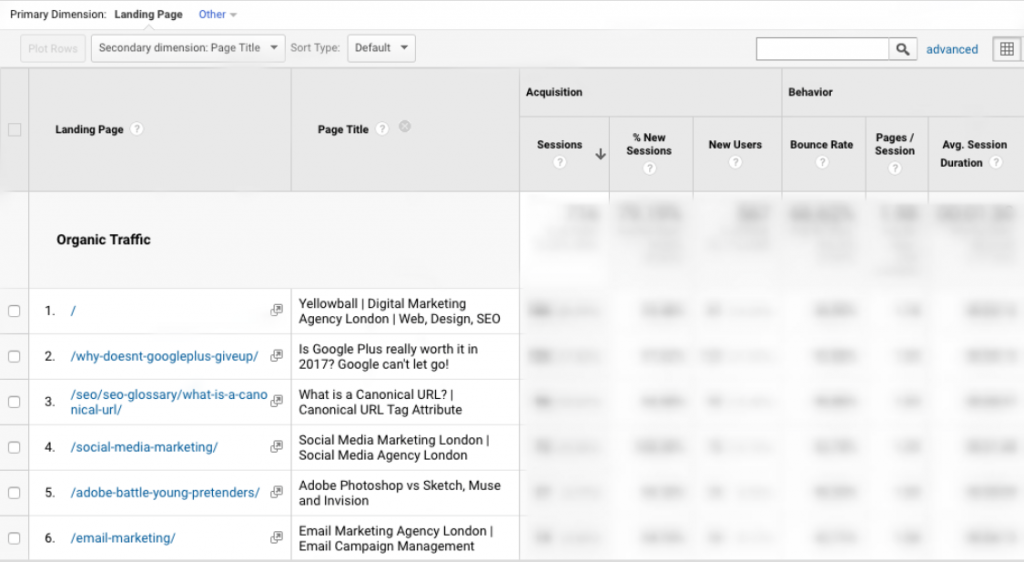
2. Landing page and page titles
Where to find it: ‘Behavior’ > ‘Site Content’ > ‘Landing Pages’ > Add secondary dimension ‘Page Titles’
One of the most frustrating aspects of Google Analytics organic reports is the dreaded ‘(not provided)’ result which features under ‘Keyword’.
This unfortunate occurrence is the result of searches which have been carried out securely. In other words, if the URL of the search engine features HTTPS or if they are logged into a Google account and therefore protected by data privacy policies. In these scenarios, the search term deployed by the user will not be provided.
But how wonderful would it be to see a list of all the search terms people used to find your site? Unfortunately I’m not a magician and I can’t abracadabra these search phrases from the Google abyss. But I can offer an alternative solution that will at least give you an overview.
View your organic traffic via landing page and page title, as this will show which pages are performing best in terms of organic search. By including the page title, you can then look at which keywords those pages are optimised for and get a pretty good idea of the search phrases users are deploying and those which are performing best in terms of traffic and bounce rate.
This can also help you identify the pages which are not performing well in terms of organic traffic. You can then review whether the keywords need refining, the onsite optimization needs an overhaul, or the content needs revamping.
3. Conversion goals
Where to find it: ‘Conversions’ > ‘Goals’ > ‘Overview’
It’s all very well having a high volume of organic traffic but if it isn’t converting then there’s really not much point. To test the quality of your organic traffic, you need to be tracking conversions. There are two levels to this.
The first is your conversion goals. You can filter these with regards to traffic and understand what percentage of a website’s conversions are resulting from organic traffic.
To further improve this data, add monetary value to your conversions to better demonstrate the value that your SEO efforts are bringing. Some clients care only about keyword rankings, some care only about the dollar signs. Either way, it’s worth spending some time with your client to work out how much each conversion is worth and the data that they are most interested in.
For example, let’s say you sell kitchens. If you know the average cost of a sale and the percentage of kitchen brochure downloads which convert to a sale, then you can work out an approximate value for each conversion.
4. Assisted conversions
Where to find it: ‘Conversions’ > ‘Multi-Channel Funnels’ > ‘Assisted Conversions’
Although useful, conversion goals only give a surface view of conversions. What if someone initially found your website via Google and didn’t convert, but then later returned to your website by typing in the URL direct and then converted?
It’s very common for users not to convert on their first visit to a website, especially if they are only in the awareness or consideration phase of the sales funnel. When returning the next time around to make a purchase, they are more likely to go direct, or perhaps they see a reminder via social media.
This is where assisted conversions can save the day. Find these by clicking on ‘Multi-Channel Funnels’ under ‘Conversions’, and then ‘Assisted Conversions’.
With this data, you can identify whether each channel featured on the conversion path of a user, therefore providing more accurate data in terms of the quality of your organic traffic.

Pay attention to any drops or surges in organic traffic in this section. If, for example, you have noticed a drop in organic assisted conversions yet your organic traffic has remained consistent, then it may indicate that the leads are no longer as qualified. This should prompt a review of your keyword and content strategy.
5. Site speed
Where to find it: ‘Behavior’ > ‘Site Speed’ > ‘Overview’
Site speed is important, we all know that. There are a number of tools we can use to find out the overall speed of a website: Google Page Insights, Pingdom, GTmetrix. However, these don’t tend to drill down into specific pages. The site speed report via Google Analytics can help you to identify any pages which are proving particularly slow.
You are likely to see a correlation between the time taken to load and the exit pages, you can also layer in bounce rate metrics.
Using this information regarding individual pages, you can then approach your development team with the cold hard evidence that they need to resolve that page speed issue.
6. Site search
Where to find it: ‘Behavior’ > ‘Site Search’ > ‘Search Terms’
If you have a site search function on your website then this report is super useful for a number of reasons. Firstly, it can indicate where the user experience may not be particularly strong on your website. If a page is proving difficult to find without having to search for it then it may hint at a wider site navigation issue.
In addition, it can also help identify any keywords or search terms which you may need to create a new page for if one does not already exist. The site search report is ideal for unearthing these gaps in your website’s offering.
Where to find it: ‘Audience’ > ‘Mobile’ > ‘Overview’
Comparing the traffic of mobile users to that of desktop and tablet is a handy way of identifying whether your site may have some mobile optimization issues. For example, if the bounce rate of mobile sessions is significantly higher than that of your desktop sessions, then you may need to carry out a mobile site audit.
It’s also worth considering the conversion rate of the different devices, as this can indicate which device traffic is the most valuable.
Given that over half of website traffic is now on mobile, you should see similar results reflected in your own analytics. Although it’s worth bearing in mind that some businesses are more likely to be more prevalent on mobile than others.
For example, a local business should feature in a lot of mobile searches, whereas a business to business service is more likely to be searched for on desktop by people sitting in an office.
8. Customize your dashboard
Where to find it: ‘Customization’ > ‘Dashboards’
Finally, for a quick overview of reporting, it pays to design a tailored dashboard for your client. We often find that clients don’t appreciate too much text or complex tables in reports, as they can be overwhelming at an initial glance.
Sure, you may be a Google Analytics whizz, but the chances are that your client isn’t. Therefore presenting the data in a way that is digestible and manageable is key to convincing them of your SEO prowess.
Create a dashboard that your client will understand. Use digestible charts, like bar graphs, pie charts and simplified tables. This will help the client visualize all of the data in one easy-to-view report. This can also be emailed to your client each week so they get regular updates.
Dashboards are created using customizable widgets. Begin by selecting the type of widget: this could be a simple metric, a timeline, a geomap, a table, or a pie or bar chart. With some widgets, you can also select whether to show a specified date range or whether to show data in real-time.
Once you have chosen your widget, you can configure the finer details, such as dimensions and other options depending on the type. Widgets can be edited, cloned or deleted, allowing flexibility in refining your dashboard as both you and your client see fit. For further information on creating a custom dashboard, have a read of Google’s handy guide.
There are a whole myriad of other reports and views available within Google Analytics; it takes time to become familiar with all the different types of data and formats. Hopefully this list has provided a solid starting point for genuinely valuable and insightful SEO reporting.

Leave a Reply
You must be logged in to post a comment.