Google Analytics (GA) has done more than any other platform to bring the practice of data analytics to the center of organizations.
By offering a free-to-use, intuitive solution to businesses of any size, it has offered the promise of full transparency into customer behavior.
Moreover, as part of the broader marketing analytics movement, it has helped shape the language we use daily. Our handy guide explains some of the most frequently heard, but at time confusing, terms GA has brought into everyday parlance in the marketing world.
Pitch decks and strategy sessions abound with references to “data-driven decisions” nowadays, which is a healthy trend for businesses overall. Beyond the buzzword status this phrase has attained, it is true that businesses that integrate analytics into the decision-making process simply get better results.
Google reports that business leaders are more than twice as likely to act on insights taken from analytics:

As Google continues to improve its offering, with Optimize and Data Studio available to everyone, and an ever more impressive list of paid products via the Analytics 360 suite, marketers need to understand the data in front of them.
Unfortunately, there are some common misunderstandings of how Google collects, configures, processes, and reports data.
The below are some of the commonly misunderstood metrics and features within the core Google Analytics interface.
By avoiding these pitfalls, you will enable better decisions based on data you can trust.
Bounce rate
What is it?
Bounce rate is a simple, useful metric that is triggered when a user has a single-page session on a website. That is to say, they entered on one URL and left the site from the same URL, without interacting with that page or visiting any others on the site.
It is calculated as a percentage, by dividing the aggregate number of single-page sessions by the total number of entries to that page. Bounce rate can also be shown on a site-wide level to give an overview of how well content is performing.
As such, it makes for a handy heuristic when we want to glean some quick insights into whether our customers like a page or not. The assumption is that a high bounce rate is reflective of a poorly performing page, as its contents have evidently not encouraged a reader to explore the site further.

Why is it misunderstood?
Bounce rate is at times both misunderstood and misinterpreted.
A ‘bounce’ occurs when a user views one page on a site and a single request is sent to the Analytics server. Therefore, we can say that Google uses the quantity of engagement hits to classify a bounced session. One request = bounced; more than one request to the server = not bounced.
This can be problematic, given that any interaction will preclude that session from counting as a bounce. Some pages contain auto-play videos, for example. If the start of a video is tracked as an event, this will trigger an engagement hit. Even if the user exits the page immediately, they will still not be counted as a bounced visit.
Equally, a user may visit the page, find the exact information they wanted (a phone number or address, for example), and then carry out their next engagement with the brand offline. Their session could be timed out (this happens by default after 30 minutes on GA and then restarts), before they engage further with the site. In either example, this will be counted as a bounced visit.
That has an impact on the Average Time on Page calculations, of course. A bounced visit has a duration of zero, as Google calculates this based on the time between visiting one page and the next – meaning that single-page visits, and the last page in any given session, will have zero Time on Page.
Advances in user-based tracking (as opposed to cookie-based) and integration with offline data sources provide cause for optimism; but for now, most businesses using GA will see a bounce rate metric that is not wholly accurate.
All of this should start to reveal why and how bounce rate can be misinterpreted.
First of all, a high bounce rate not always a problem. Often, users find what they want by viewing one page and this could actually be a sign of a high-performing page. This occurs when people want very specific information, but can also occur when they visit a site to read a blog post.
Moreover, a very low bounce rate does not necessarily mean a page is performing well. It may suggest that users have to dig deeper to get the information they want, or that they quickly skim the page and move on to other content.
With the growing impact of RankBrain, SEOs will understandably view bounce rate as a potential ranking factor. However, it has to be placed in a much wider context before we can assume it has a positive or negative impact on rankings.
How can marketers avoid this?
Marketers should never view bounce rate as a measure of page quality in isolation. There really is no such thing as a ‘good’ or ‘bad’ bounce rate in a universal sense, but when combined with other metrics we can get a clearer sense of whether a page is doing its job well.
Tools like Scroll Depth are great for this, as they allow us to see in more detail how a consumer has interacted with our content.
We can also make use of Google Tag Manager to adapt the parameters for bounce rate and state, for example, that any user that spends longer than 30 seconds on the page should be discounted as a bounce. This is useful for publishers who tend to receive a lot of traffic from people who read one post and then go elsewhere.
This is commonly known as ‘adjusted bounce rate’ and it helps marketers get a more accurate view of content interactions. Glenn Gabe wrote a tutorial for Search Engine Watch on how to implement this: How to implement Adjusted Bounce Rate (ABR) via Google Tag Manager.
Bounce rate can be a very useful metric, but it needs a bit of tweaking for each site before it is truly fit for purpose.
Channel groupings
What is it?
Channels are sources of traffic and they reflect the ways that users find your website. As a result, this is one of the first areas marketers will check in their GA dashboard to evaluate the performance of their different activities.
There are many ways that people can find websites, so we tend to group these channels together to provide a simpler overview of traffic.
Google provides default channel groupings out of the box, which will typically look as follows:

You can find this by navigating this path: Admin > Channel Settings > Channel Grouping.
Anything that sits outside of these sources will fall into the disconcertingly vague ‘(Other)’ bucket.
From Google’s perspective, this is a reasonably accurate portrayal of the state of affairs for most websites. However, this is applied with broad brush strokes out of necessity and it shapes how marketers interpret very valuable data.
Why is it misunderstood?
Default channel groupings are often misunderstood in the sense that they are taken as the best solution without conducting further investigation.
Vague classifications like ‘Social’ and ‘Referral’ ignore the varying purposes of the media that fall under these umbrellas. In the case of the former, we would at the very least want to split out our paid and organic social media efforts and treat them separately.
We want channel groupings to provide a general overview, but perhaps it needn’t be quite so general.
Leaving these groupings as they are has a significant impact, particularly when it comes to the eternal riddle of channel attribution. If we want to understand which channels have contributed to conversions, we need to have our channels correctly defined as a basic starting point.
How can marketers avoid this?
Make use of custom channel groupings that accurately reflect your marketing activities and the experience your consumers will have with your brand online. It is often helpful to group campaigns by their purpose; prospecting and remarketing, for example.
Custom channel groupings are a great option because they alter the display of data, rather than how it is filtered. You can modify the default channel groupings if you feel confident about the changes you plan to make, but this will permanently affect how data is processed in your account. Always add a new view to test these updates before committing them to your main account dashboard.
For most, custom channel groupings will be more than sufficient.
Through the use of regular expressions (known commonly as regex), marketers can set up new rules. Regex is not a particularly complex language to learn and follows a clear logic, but it does take a little bit of getting used to. You can find a great introductory guide to regex expressions here. These rules will allow you to create new channels or alter the pre-defined groupings Google provides.
Your new channel groupings will be applied to historical data, so you can easily assess the difference they make. These alterations will prove especially invaluable when you compare attribution models within GA.
Custom Segments
What are they?
The array of segmentation options available is undoubtedly one of Google Analytics’ most powerful advantages. Customer segments allow us to view very specific behavioral patterns across demographics, territories and devices, among many others. We can also import segments created by other users, so there is a truly vast selection of options at our disposal.
By clicking on ‘+ New Segment’ within your GA reports, you will be taken to the Segment Builder interface:

Google provides a very handy preview tool that shows us what percentage of our audience is included under the terms we are in the process of defining. This will always begin at 100% and decrease as our rules start to hone in on particular metrics and/or dimensions:

This is where it starts to get tricky, as the segment builder can start to produce unexpected results. A seemingly sound set of rules can return a preview of 0% of total users, much to the marketer’s chagrin.
Why are they misunderstood?
The underlying logic in how Google processes and interprets data can be complex, even inconsistent at times.
When we set up a set of rules, they will be treated sequentially. A session will need to pass the first condition in order to reach the second round, and so on. We therefore need to consider very carefully how we want our experiments to run if we want them to be sound.
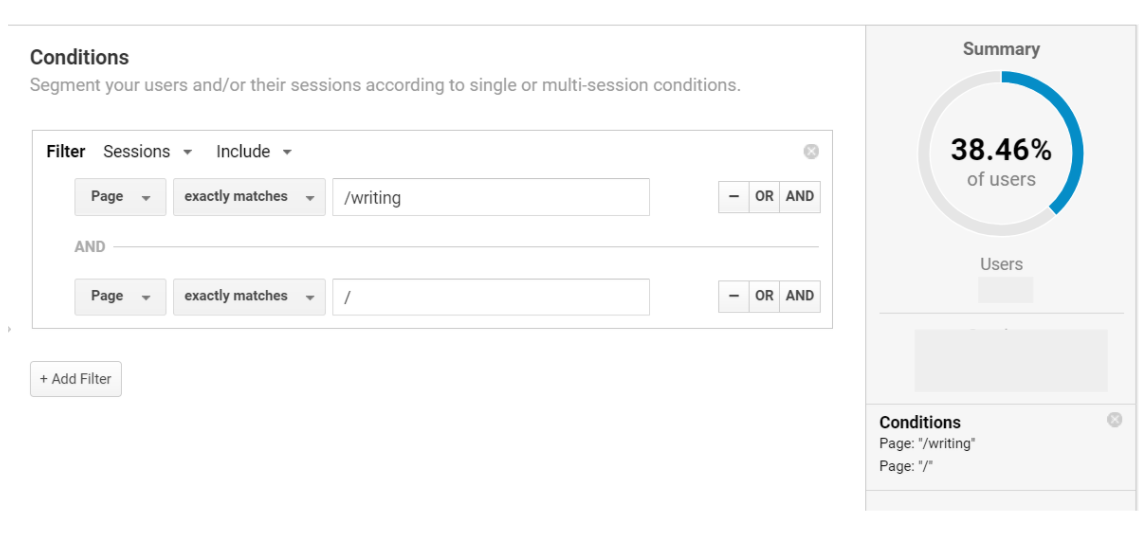
To take a working example, if I want to see how many sessions have included a visit to my homepage and to my blog, I can set up an advanced condition to cover this. I filter by sessions and include a condition for Page exactly matching the blog URL and Page exactly matching the homepage:

This creates what seems like a valid segment in the preview.
Logically, I should be able to take this up one level to see what proportion of users meet these conditions. Within the GA hierarchy, users are a superset of sessions, which are in turn a superset of hits.
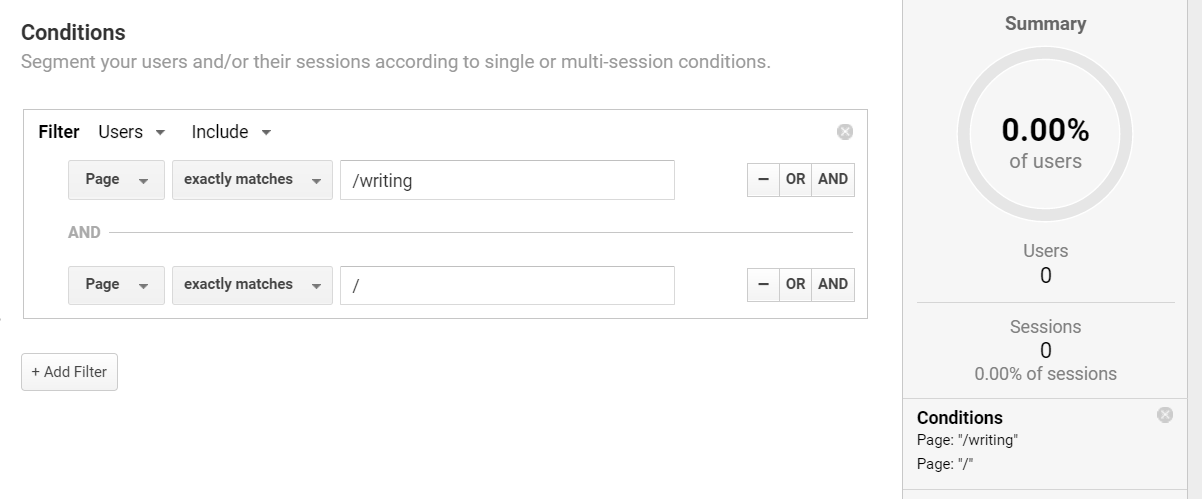
However, this is not how things play out in reality. Just by switching the filter from ‘Sessions’ to ‘Users’, the segment is rendered invalid:

Why does this occur?
Google uses a different logic to calculate each, which can of course be quite confusing.
In the former example, Google’s logic allowed room for interpretation, so the AND condition loosely meant that a session could include visits to each page at different times. As such, some sessions meet the requisite conditions.
In the latter example, the AND rule means that a user must meet both conditions simultaneously to be included. This is impossible, as they cannot be on two pages at once.
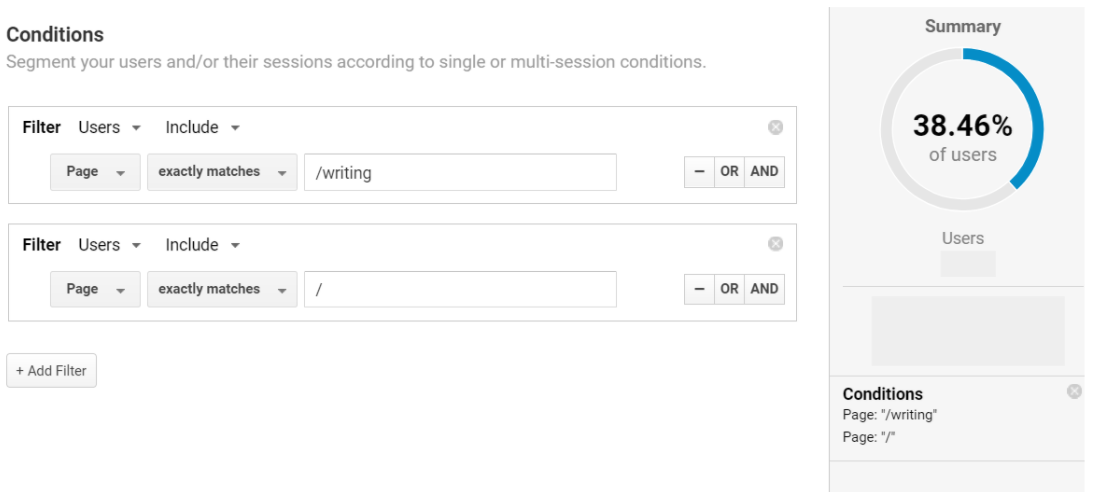
We can still arrive at the same results, but we cannot do so using the AND condition. By removing the second condition and adding a new filter in its place, we can see the same results for Users that we received for Sessions:

In other words, we need to be very specific about what exactly we mean if we want accurate results from segments created for users, but not quite so explicit with sessions.
It is better to err on the safe side overall, as the logic employed for Users was rolled out more recently and it is here to stay. The complexity is multiplied when a segment contains filters for users and for sessions, so it is essential to maintain some consistency in how you set these up.

How can marketers avoid this?
By understanding the hierarchy of User – Session – Hit, we can start to unpick Google’s inner workings. If we can grasp this idea, it is possible to debug custom segments that don’t work as expected.
The same idea applies to metrics and dimensions too, where some pairings logically cannot be met within the same segment. Google provides a very comprehensive view of which pairings will and will not work together which is worth checking out.
Although it does involve quite a bit of trial and error at first, custom segments are worth the effort and remain one of the most powerful tools at the analyst’s disposal.

Leave a Reply
You must be logged in to post a comment.