How to use data to justify SEO fixes
What if I told you I could give you a process which can put a definitive number on the returns you would get from SEO fixes?
What if I told you I could give you a process which can put a definitive number on the returns you would get from SEO fixes?
SEO fixes tend to get pushed further down the development queue as their benefit is harder to put a number on. While you can usually put a definitive number on CRO or UX fixes, SEOs tend to fall into the trap of parroting back Google guidelines, or best practice recommendations, which quite frankly do not stand up to the scrutiny of hard and fast projections.
What if I told you I could give you a process which can put a definitive number on the returns you would get from SEO fixes? At Zazzle Media, we lead all our recommendations with data. We ground this with keywords, but then pull all the information we can about our competitors to make informed decisions. We then use past, current and predicted keyword rankings for the affected pages and project traffic levels based upon estimated click through rates.
Why do we use keywords to estimate traffic levels when we already have traffic in Google Analytics? GA is not as clean a data set. You’re not going to get an improvement to your branded traffic levels so it will need to be excluded from your data set, and this is pretty much going to be guesswork. Seasonal traffic also need to be removed; while search volumes are subject to seasonal volume alike, we’re looking to measure the impact excluding these factors. A yearly average of search volume is sufficient for this. Stripping out seasonality from GA traffic is trickier.
Keyword rankings exclude the white noise which affects Google Analytics, and allows us to sidestep the above tricky questions. Once completed you will be able to say:
“The current average ranking position of the four affected pages is 5.4. Should we fix the issue it will affect 78 keywords in ranking positions, moving our average position across the pages to 4.2, which will equate to an additional 6428 clicks per year. For a full breakdown of the affected pages and keywords please see my report.” Now that is how to win an argument!
To complete this task, you will need a complete list of keywords, search volumes and rankings. From there we’ve got a great little template which puts it all together and which you can download here.
So to begin with you’ll need all the keywords you rank for. When I say all I mean all. You only get out what you put in and I cannot stress how critical it is to this task that you get every possible keyword you rank for. Here’s how I would do it. First I’d go into every rank tracking tool; SEMRush, AHrefs, Sistrix and others and export a full list of my domain’s keywords, ranking and search volumes.
Don’t neglect the free tools! Google Search Console and the Adwords Keyword Planner are both invaluable additions which some of you will have to lean on more should you have a limited toolset.
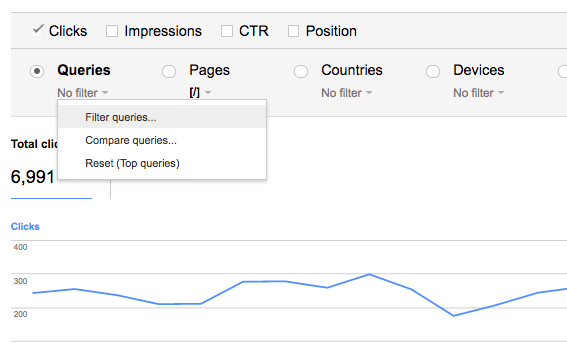
While the export feature in the GSCs Search Analytics report only allows up to 1000 rows at a time, you can get around this restriction with filters. Only select a single URL and pull an export. Make sure you’re keeping tracking of the URL in the export as you will need this later.
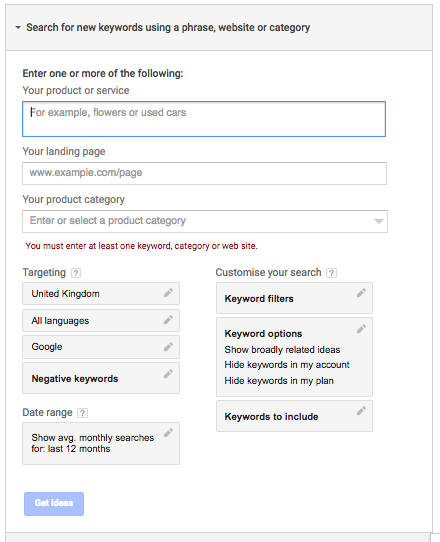
Another way of getting a ton of free keywords is with the keyword planner report. Take full advantage of every report available here; product/service (your keywords), top landing pages and the multiply keyword combination report.
By this point you should have a monster set of keywords. Get them all into a single sheet and remove duplicates. Here you want to sense check your keywords for irrelevant/branded keywords which won’t be delivering any targeted traffic. Without a clean data set our analysis is pretty much useless so make sure you’re hot on this.
You’ll need up to date rankings for every single one of your keywords – if you haven’t already get these you can use URL profilers simple serp scraper. You’ll also need search volumes which will be a bit of a pain if you haven’t got access to an active adwords account. I’m currently using the chrome bookmark Keywords Everywhere which is a good alternative.
Once you’ve got all this it’s time to fire up our keyword template. Go straight to the Keywords and Rankings sheet and copy your keywords, search volumes, rankings and ranking URLs into the relevant columns. From here on in drag the formulas present in rows G through to K down to the bottom of your keyword set and you should have something resembling the following:

I’ve hidden the categorisation tabs here as we don’t need it initially. This template is a great strategy tool with a large range of uses, but as we’re only concerned with traffic by URL for this task most of it isn’t required. If you would like to look into the other uses for this template you can read up on it at our blog.
Okay – now to explain what’s going on. The estimated traffic column will multiply the search volume by the relative position’s click-through rate (estimated CTRs are available in the CTR Ref sheet). So for example, if you were in position one for 1,000 searches a month keyword, you’d capture 26% of the searches which would equal 260 clicks per month.
The maximum traffic column simply multiplies the search volume by position one’s CTR to give you the total traffic you could ever capture for the associated keyword.
The incremental traffic column takes the current traffic away from the total traffic to give you an estimate on how much traffic is available for your keyword to capture should your rankings increase.
Position range and opportunity group pull in from their relative position on the CTR Ref sheet. We will come back to these later.
So the easiest way to sort through all this data is through a pivot table. Highlight all the columns, then insert a pivot table into a new sheet and use the following setup:
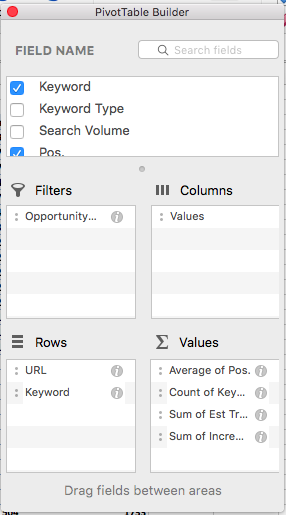
Sort your rows by URL and then keyword. This allows us to see a breakdown of the total performance of each of your URLs, while expanding the field can show individual keyword performance.
Columns are sorted by values. We can now see the average position of your URL, amount of keywords the URL ranks for, the total traffic going into this page and the total incremental traffic available.
It is important to filter your pivot table by opportunity group and exclude long terms and no ranking keywords. This allows you to only see keywords which are currently giving you traffic, making the incremental metric as relevant as possible as it won’t be skewed by keywords we have no chance to rank well for.
Finally, sort your URL by estimated traffic and you will be left with something like this:
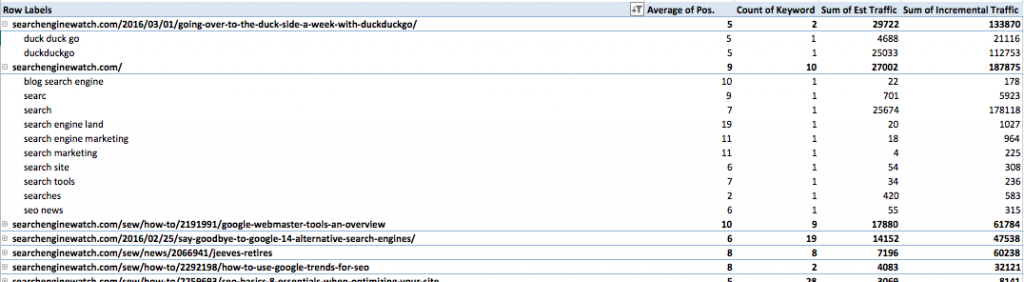
I just ran a quick export of search engine watch’s keywords. You can see that I didn’t exclude any branded or irrelevant keywords straight away. Apparently SEW are getting a ton of traffic from the term Duck Duck Go. I don’t think so! Do you think they get traffic for the term Search Engine Land? That one is up for debate. I personally would go into GSC’s Search Analytics report for guidance here; if it shows up high on the list keep it in. Here is is updated pivot table which looks more accurate:

Now, you’ve got all the tools you need to build a business case. Technical fixes you’re chasing will broadly fall into two categories, proactive and reactive. You’ll need to use the tool differently in each instances so I will run through a few examples below.
We’re going to use proteinworld.com as the example here. Let’s say we don’t think our internal linking is optimised for search. Key pages are several clicks from the homepage and we want to improve this but don’t know where to begin.
We begin as we always should, by following the above methodology. This allows us to benchmarking our current performance; we end up with an ordered list of amount of available growth by keywords which are already ranking well. This is our foundation.
I would then do a screaming frog crawl of the site and get the clicks from homepage metric. Add these onto the end of the Keywords and Rankings sheet and update your pivot table to include your results. We now have a table which looks like this:

Here we can see straight away, the top page isn’t even the homepage. It’s a whey protein product page which is three clicks from the homepage. In fact, only two (three with the homepage) out of the top ten pages are in the main navigation! We’ve now identified a significant opportunity to improve the visibility of multiple pages on site.
We now need to work through them individually to analyse how much growth we can achieve. We can’t predict a positional increase without understanding what we are up against. We need to compile our competitors’ rankings, technical implementation and website authority, then we need to find a competitor with similar metrics to us, just who have better internal linking. The difference in traffic should be a projected traffic increase; simple right?
I actually just started again with a fresh spreadsheet at this point, but I just like to have things clean. So I took every keyword which the whey protein page ranked for, I pulled off every ranking URL and their relative position and added it to my new spreadsheet. I quickly identified the top sites by estimated traffic and number of keywords ranking for and ran all the top sites through screaming frog to get the clicks from homepage metrics. Finally, I ran my domains through URL profiler to get their trust flow (Ahref’s domain rating is just as good metric for this).
The theory here is that, while you can build links to improve your site’s authority, the overall authority is relatively out of your control. Replicating a fix to move your site in line with Amazon technically is not going to elevate your rankings to their level if your domain’s authority sucks.
Here are my results, rows are ordered by domain and sorted by count of keywords:

As I have sorted columns by domain and then URL, expanding the sections allow me to see exactly where this traffic is coming from:
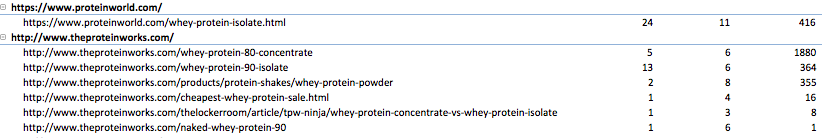
We can go one step further and see which keywords are driving the traffic:

They’re absolutely killing it on the head term. P.5 on the term whey protein with a product page, with lower authority metrics. How are they doing it? Surely it can’t be just the internal linking? Of course it’s not.
If you take a look, their on-page content is awesome:
http://www.theproteinworks.com/whey-protein-80-concentrate

They’ve got star ratings, reviews and an absolutely awesome FAQ content section at the bottom of the page:

This is great news for us though, as it is something we can go out and do a lot quicker than say, boosting your trust flow by 30 points. Reviews might need development time… if only you have a business case for that.
All we have to do is go to our pivot table. Grab our current traffic estimates and our competitors’ estimates, and then pull off affected URLs. So in this instance:
https://www.proteinworld.com/whey-protein-isolate.html
(etc).
We then just repeat the process for every affected URL which we believe is under-optimised. This basic process applies to any proactive fix you want to push through:
Reactive fixes are a lot easier to project; the most important part of the exercise is to regularly run rankings, especially before and after technical fixes are deployed. Let’s say, for example, that your site does a redesign and despite your wishes, the new category template moves the main body of content below the fold.
In the template just duplicate your positional and estimated traffic volumes, and add in a new column which takes the new estimated traffic from the old.

Jump into the pivot table and update it, comparing your affected URLs pre and post launch traffic and build a business case from this. Here is an example of what this might look like:
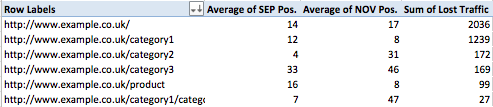
We’ve got the average positions and lost traffic all laid out for you. If you sort the pivot rows by URL and then keyword you can highlight exactly where you have lost traffic at the click of a button.
A weak argument which parrots Google guidelines and best practices is unconvincing, especially to the uninitiated to SEO. We can all understand data, we can all understand competitor intelligence. Using this approach wins arguments and silences doubters.
Failure to justify your recommendations can see even the best recommendations fail to get off the ground.
Tom is a Search and Data Consultant at Zazzle Media and a contributor to Search Engine Watch
Leave a Reply
You must be logged in to post a comment.