Visualising geographic data in Excel 2016: move over GeoFlow, 3D maps are now built-in!
Back in 2013 John Gagnon continued his popular series of posts about powerful spreadsheet use with a handy how-to guide for using the add-in GeoFlow for Excel.
Back in 2013 John Gagnon continued his popular series of posts about powerful spreadsheet use with a handy how-to guide for using the add-in GeoFlow for Excel.
Back in 2013 John Gagnon continued his popular series of posts about powerful spreadsheet use with a handy how-to guide for using the add-in GeoFlow for Excel.
We thought we’d revisit John’s article and update it to reflect the latest geo-data functionality on offer in Excel 2016, as we have with VLOOKUP and other easy Excel shortcuts.
GeoFlow was basically Excel charting plus Bing Maps on steroids. With geographic data from reports, like clicks by geographical location in Bing Ads, it can automatically detect each city on the map and overlay your click data. It was really easy to use.
The Geoflow add-on was so popular, in fact, that Microsoft have decided to incorporate (and build on) its functionality into the latest version of Excel as standard. As you can see, it visually looks pretty much the same as GeoFlow for Excel 2013 and it is still powered by Bing.

You’ll need data to use 3D Maps. John’s data set was a Bing Ads geographic location report by day for the last seven days – but use data you’re comfortable with (e.g., website analytics visitor reports).
Microsoft offer some fun sample datasets here to help you get started.
3D maps in Excel 2016 are far quicker to start using for the first time. You don’t need to download any add-ons like back in the GeoFlow days, simple select the ‘Insert’ menu tab and click the ‘3D Maps’ button.
Or alternatively, hit ALT, N (to get to the ‘Insert’ tab) and then ALT + SM selects the map functionality.

3D Maps then offers you a new window with your map in the centre, ‘scenes’ to the left and a layer pane to the right where you can verify that the right fields relate to the correct geographic data.
For instance, ensure that 3D Maps knows longitude from your data relates to its own notion of longitude.

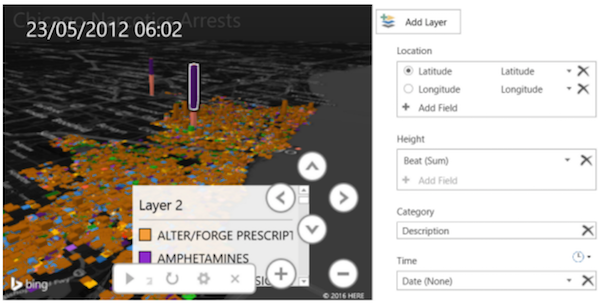
As with GeoFlow, 3D Maps allows you to really get amongst the data. PPC marketers, you can dig into clicks, conversions, or whatever interests you. For this example, I’m looking at narcotics arrests in Chicago (as per Microsoft’s sample suggestion).
In the layer pane, click on ‘Add Field’ under each metric to choose your selected data. I’ve added ‘Beat’ to the ‘Height’ metric to get an indication of arrest volumes, ‘Description’ in the ‘Category’ colours the columns in relation to the type of drugs people were arrested for and under ‘Time’ we have ‘Date’.
The data starts to populate automatically.

You can zoom into regions and hover over columns to get more information about any area of your choice.
Like in GeoFlow, 3D Maps allows you to see data changes for areas over time.
Simply ensure that you have your ‘Date’ data added into the ‘Time’ metric of the maps layer pane and press play.
Excel’s new 3D Maps adds more functionality to what was found in GeoFlow. Scenes and tours offer user-friendly playback of time based data changes.
So if you’re working in PPC and want to show click rate changes over different locations for a certain time period, it is very easy to set up a number of scenes into a tour. You can then export that tour as a video to share with whomever you like.
It’s great that Microsoft has included map functionality as standard and built on the GeoFlow tool for Excel 2016.
There’s such an abundance of data and an ever-growing need to make it as accessible as possible that being able to present trends over geographic regions in a dynamic way will no doubt be valuable to marketers – especially those working to improve their campaigns and who want to share findings with colleagues and clients.