29 most interesting SEM stats from March 2016
As we leave March behind and look forward to the comparatively warmer weather of April, let’s continue to stay indoors while looking at a laptop screen and revisit the most interesting online stats of the last four weeks because it’s probably going to rain today anyway.
Grumpy weather humour! Let it not be in any doubt that the editor of this website is British.
According to Marin in an analysis of $7.8bn of annualised ad spend, mobile has overtaken desktop for the first time, with more than 50% of budgets spent on mobile ads.
Kenshoo published new research revealing some early results from Google’s recent removal of Right Hand Side Ads.
Among the key revelations from the first week the change happened:
Possibly surprising nobody, the click-through rate has increased on paid search results at the top of the screen.
Accuracast has taken a look at the CTR during the 7-day period before and after the change in ad placements on Google desktop search.

It shows a large increase of 18.2% for ads in position 4, and substantial increases for position 1 and 2 (8.4% & 7.7% respectively).
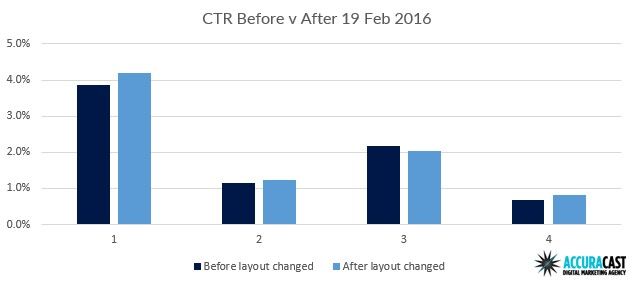
Interestingly, the only ad position where the CTR dropped after the change, has been for position 3.
According to a survey of 9,142 online consumers in the US and Canada by Bizrate Insights (a division of Connexity), 73% of online buyers use mobile devices to shop online.
However, only one in five (21%) use mobile devices to assist their in store shopping experience.
In a Think With Google post this month, Lisa Gevelber offered up loads of juicy stats and guidance on where to begin with mobile search, particularly for luxury brands.
Here’s a quick run-down:
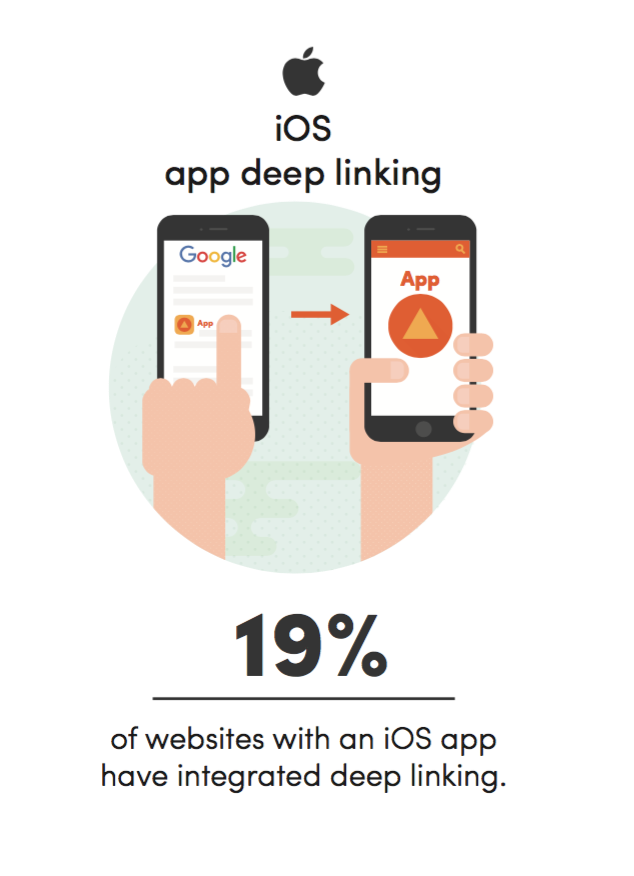
Brands are missing out when it comes to enabling deep linking in their apps, which allows Google to crawl its content beyond the mobile web.
According to Searchmetrics, in a study of the 100 most visible websites in Google US searches, it’s been found that although 84% offer an Android App, only 30% of these had implemented app-indexing.

And then of the 88% that offer an iOS app, just 19% were found to be support app-indexing.
According to eMarketer, total digital spend will surpass TV for the first time next year.
In 2017, TV ad spending will total $72.01 billion, or 35.8% of total media ad spending in the US.
Meanwhile, total digital ad spending in 2017 will equal $77.37 billion, or 38.4% of total ad spending.
By 2020, TV’s share of ad spending will drop below one-third.
As Chris Lake reported this month, a recent TrackMaven report has looked at the content marketing activity of almost 23,000 brands and their 50m published pieces of content.
It turns out that the average brand publishes more than 2,000 pieces of content a year, and in 2015 this increased by 35% compared to the previous year.
Although there were a total of 75.7bn interactions, the average engagement actually decreased by 17%.
The chart below shows the widening attention gap, based on the volume of shares on social platforms vs response rates.

For more detailed analysis, check out the report.
Kenshoo has published a new report on mobile app advertising detailing a few interesting industry trends, including…
It was only in January when Snapchat stated it had 7 billion video views per day. Now, barely more than a month later, you can add another billion to that number.
This is even more impressive when you consider that Snapchat had ‘just’ two billion daily video views in May 2015.
According to Recode Snapchat is serving the same number of daily video views as Facebook.
Leave a Reply
You must be logged in to post a comment.