12 fascinating SEM related stats from January 2016
As it's now February, let's take a look back at January's most interesting online stats that will perhaps point you in the right direction for what to expect for the rest of the year.
As it's now February, let's take a look back at January's most interesting online stats that will perhaps point you in the right direction for what to expect for the rest of the year.
As it’s now February, let’s take a look back at January’s most interesting online stats that will perhaps point you in the right direction for what to expect for the rest of the year.
Here we have everything from display ad spend, ‘peak tech’, in-app customer care, data failure, ad blockers to native ads and the true value of brand activity on social.
And almost one-third of the world uses social media, according to We Are Social’s latest global snapshot.
The key statistics for digital, social, and mobile media in 2016 are:

eMarketer revealed that digital display ad spend will surpass search ad spend in the US for the first time ever in 2016. The categories of video, sponsorships, rich media and “banners and other” will account for the largest share of digital ad spending (47.9% – worth $32.17 billion). Within the display category, one in five dollars budgeted will go to “banners and other”
Research from the 2016 Accenture Digital Consumer Survey reveals that consumer demand for new tech is stalling. Sales of smartphones, tablets and laptops are sluggish and demand for internet of things (IoT) enabled devices isn’t growing fast enough to “offset
Accenture polled more than 28,000 consumers in 28 countries and found that 48% of people are planning to buy a new smartphone in 2016 compared to 57% last year.

Click here for the full infographic.
In 2015, 38% of consumers had planned to purchase a new TV or tablet, this has now fallen to 30% for TVs and 29% for tablets.
As for IoT devices, consumers cite the expense (62%) and privacy fears (47%) as reasons for lack of adoption.
That being said, a surprising 8% of people plan to purchase a virtual reality headset in 2016. At least you’ll be able to clearly see which 8% of the population to avoid while walking down the street.
According to Contact Solutions’ Digital Disconnect report (registration required) a huge 75% of the 1,004 people surveyed said they’d rather use a mobile app for customer service because of their convenience.
Unfortunately 95% of apps force users to exit and transfer to a ‘live’ channel such as phone or live-chat.
A key revelation is that 53% of customers would spend more money with a brand if they could switch channels or devices to carry on their conversation and not have to repeat themselves.
According to a survey by Trusted Media Brands Inc on preferred mobile advertising formats, 45% of marketers say they’re going to use native ads in 2016, a dip of 5% from 2015. Marketers complain that native ads are hard to measure, not easy or quick to produce and the sell through rate for native, even for sites with a stated emphasis on the format can be 5% or less.
According to the IAB, 50% of UK marketers are using programmatic for buying smartphone inventory.
According to a report published on Warc (registration required) only 7% of consumer actions in response to brand-related content on social takes the form of actually sharing the material.
Tania Yuki, Founder/CEO of social content analytics firm Shareablee, reported that:
From January to October 2015, US brands published 35m posts across Facebook, Twitter, and Instagram, sparking 65bn actions with social audiences (i.e., comments, shares, retweets, etc.) Yet just 7% of these actions involved sharing of a brand’s content… despite what is increasingly recognised as the value of shared content for building brand equity.
CMO Council’s Predicting Routes to Revenue report (registration required) reveals that despite the volume of data at marketers’ disposal, organisations are poorly equipped to offer a more personalised experience.
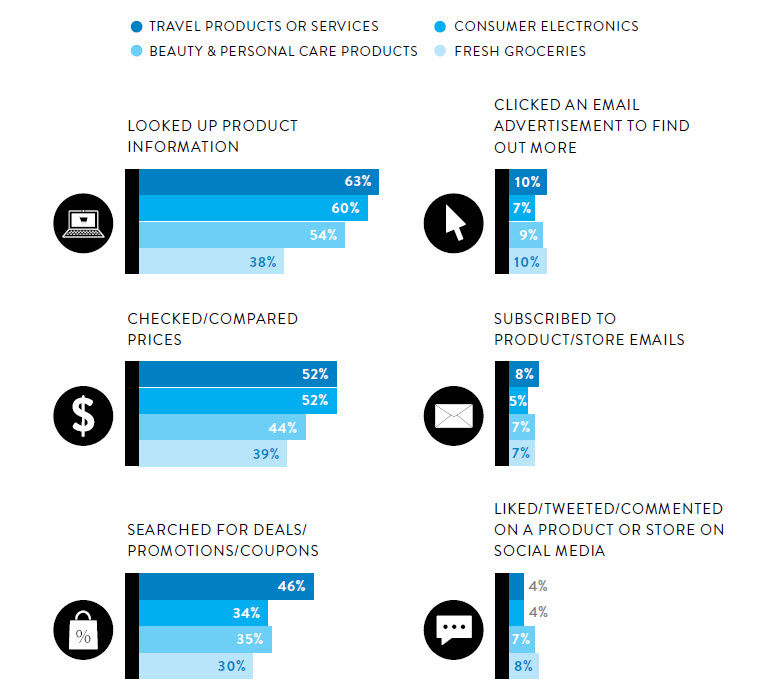
According to Nielsen, people are “less inclined to simply go to the nearest store [instead] they grab the nearest digital device.
And what is the primary use of a digital device? Research and bargain hunting, and it’s the travel sector which enjoys the most activity…
The report also reveals that 57% of respondents had purchased from an overseas ecommerce retailer in the last six months.
According to IgnitionOne’s Q4 2015 Digital Marketing Report (registration required), Google surpassed Facebook in growth and conversions, seeing an increase of 37% in programmatic display advertising spend and a 34% increase in conversions. Facebook saw an increase of 22% in growth and 17% in conversions.
The cost of Facebook ads experienced a drop, with eCPMs down -6% YoY. Whereas Google saw an eCPM growth of 16%. The report suggests this is largely down to fewer (but larger) ads being shown to users.
A report from The Global Center for Digital Business Transformation surveyed 941 business leaders around the world in 12 industries and surfaced several “troubling findings” in regard to businesses ability to adapt to digital transformation.
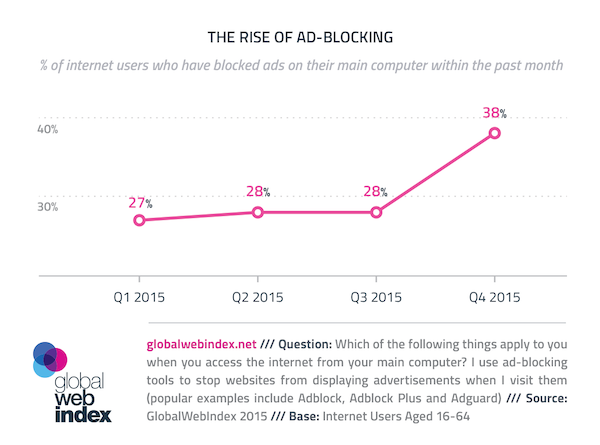
Data from GlobalWebIndex (GWI) showed a 10 percentage point rise (from 28% to 38%) in the use of adblocking software in Q4 2015, after little movement in the first three quarters of the year.
Leave a Reply
You must be logged in to post a comment.