Are you searching for that super secret insight in Google Analytics that will fuel the next big win for your conversion rate optimization (CRO) testing program? Big data expert Sinan Aral from the New York Times Research & Development Labs suggests the power of visualization.
“We’ve found that visualization is one of the most important guideposts in this search for knowledge, essential to understanding what we should look for,” Aral said in a recent HBR article.
The Google Analytics Visitors Flow report is truly a handy way to visualize what’s happening on a website. Today’s the day you turn it into your secret CRO weapon and glean big insights from it before your next test.
What is the Visitors Flow Report?
The Visitors Flow report illustrates how visitors arrive at your website and the most common paths they take during their visits. An intelligence algorithm clusters groups of pages together into interaction nodes, which appear as green blocks on the report.
The gray dimension blocks illustrate how traffic lands on your site via your interaction nodes. The connections between the interaction nodes are either gray or red, indicating whether users moved from one page to another or if they left the website, respectively.
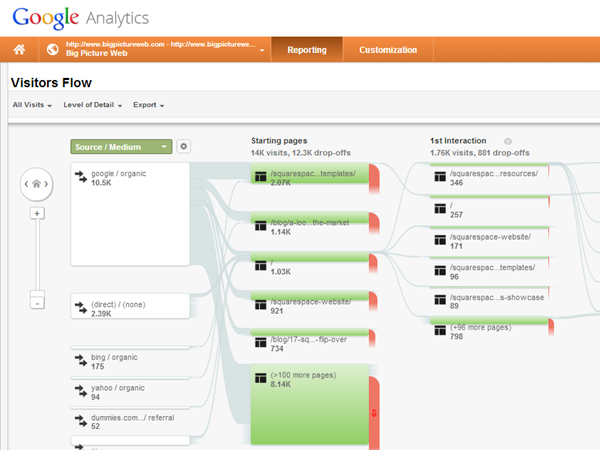
As with most other reports, you can apply any advanced segments to Visitors Flow. For example, you can segment for only those visitors that convert (i.e., take action) to better understand the “typical” experience on your site. Conversely, you can segment by those who didn’t convert to also see the not-so-great experiences.
Segment the Visitors Flow report for different locations, campaigns, and anything else that will help you hone in on the important parts of your analysis.
You can also change the dimensions of the Visitors Flow report. By default, the Visitors Flow report shows how different source/medium combinations made their way through the website. Right-click any of these dimensions or interaction nodes to highlight only traffic through that dimension or node.
Those are the basics of the Visitors Flow report. Now let’s explore how to use it for CRO testing.
Where Visitors Flow Comes in Handy for CRO
Great CRO tests are often the result of insightful analyses. Big insights, as the fellas from the New York Times R&D Lab refer to them, often start with a visual. That’s where Visitors Flow really starts to become a compelling report.
Any CRO testing program worth its salt will begin with a holistic evaluation of the website to determine which pages receive the most visits, where conversions occur and where conversions should occur but fail to do so. It’s common to head straight to the Google Analytics Content reports, but these reports only show rows and rows of URLs along with their associated metrics. They don’t give you a sense at all of how people interact.
The Visitors Flow report takes all of this quantitative data and lays it out visually, telling a much more nuanced and in-depth story of what happened on the website. Take this campaign, for example:
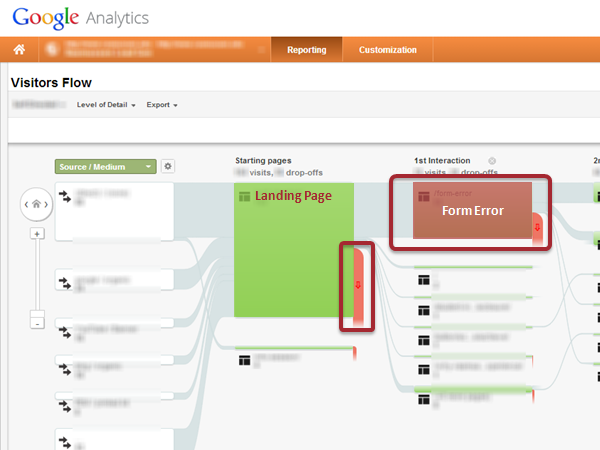
It takes about two seconds to realize that there is a crippling form error occurring – thanks to the creation of a virtual page view when a user triggers a form validation error – which comprises a large percentage of visitors after their first page. There’s a major issue with the experience here and a need to troubleshoot issues with the campaign form. Also, it’s clear that the campaign landing page has a high bounce rate and should be further analyzed for reasons why it isn’t resonating with visitors.
Visualizing user behavior can also help make sense of what would otherwise be a hopeless list of rows of data. This campaign has a relatively low bounce rate and no one page appears to be sending people away from the site:
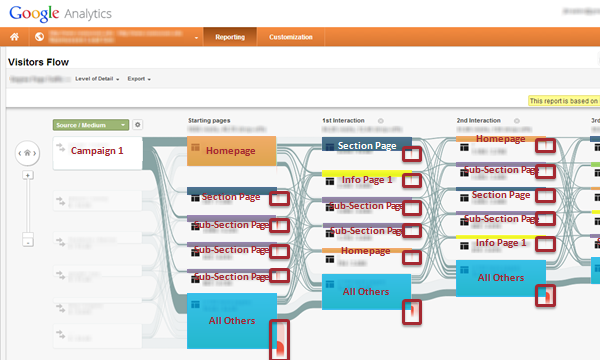
But by looking deeper, a pattern emerges where users are bouncing back and forth between section and sub-sections within the website hierarchy, never quite finding that which they seek. Folks land, they poke around for a few pages and then they leave, often without ever finding the information meant to convince them. In this case, Visitors Flow helps us see that perhaps the information architecture needs to be reviewed to ensure that your visitors are finding the information they seek.
Visitors Flow can also help you spot some of your biggest CRO testing targets. This website lives or dies on the success of its homepage and a key information page:
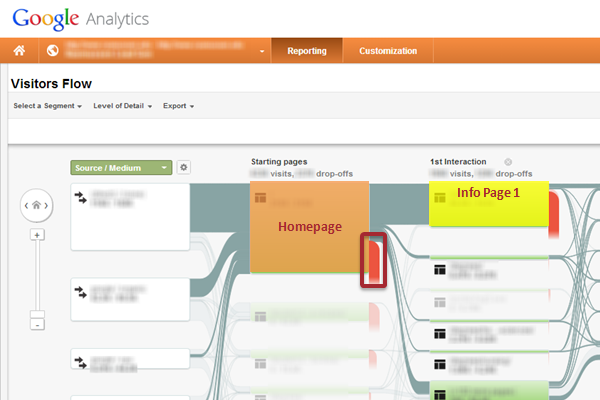
Clearly both key pages have a lot of volume moving through them but are underperforming, which makes them perfect targets for CRO testing. Let’s stick with this example and walk through how to use the Visitors Flow report as the first step in a CRO test plan.
5 Steps to Creating a Killer Test with Visitors Flow
Once you have a page to test, it’s time to analyze your page for insights before you build a challenger. Don’t even think about creating your test hypothesis or your challenging variations until you’ve gone through this process. Not every test will involve all of these steps, but you should mix and match them the best you can. You can never have too many insights.
Step 1: Google Analytics Deep Dive
The Visitors Flow report is a good starting point, but you’ll also want to examine your test control page from other reports within Google Analytics. Look for changes in traffic, engagement and conversion that might tell you where to dig deeper.
Step 2: Ask Your Visitors What’s Missing
If users aren’t converting on your website, something about the experience is missing. Quantitative data tell us what happened but it doesn’t tell us why. Using qualitative survey tools such as Qualaroo on your website can dig into the why when a page isn’t performing.
Do yourself a favor and install a Qualaroo survey across your entire site asking three questions:
- Did you find what you were looking for?
- How satisfied were you with your visit today?
- Is there anything we can add to this page to make it more useful?
Qualaroo allows you to export and segment your survey results so you can focus in on how a particular page is performing. Are people able to complete their tasks? Are they satisfied? What information do they want on the page to make it more useful? Do this now and you’ll have incredible page-level insights at your fingertips when you need them.
Step 3: Walk in Your Visitors’ Shoes
UserTesting.com provides an option for fast, affordable remote usability testing utilizing real live users, which often reveals a disconnect between the experience we think we’re providing and reality. Where Qualaroo is about qualitative metrics, Usertesting.com is all about gaining perspective into the minds of your customers.
If you’re trying to understand how consumers start researching, instruct Usertesting.com users to perform a Google search around finding a solution to the problem your product or service solves. Their screens and voices are recorded as they step through tasks so you’re able to observe their entire thought process.
Once you have a good idea for the normal process, give them your web page’s URL and have them try to complete the task. Make note of any frustrating or head-scratching moments your users have and add these notes to your analysis.
Step 4: Ask the World What They Think
At this point you’re going to have some pretty juicy insights for improving your page, and you’ll have some conflicting opinions internally about how to re-imagine the page in question. The next step is to run a Google Consumer Survey to determine which labels to use, which images appeal to people most and which headlines are the most compelling.
These surveys are cheap and act sort of like AdSense. Publishers allow Google to serve up these surveys as a way to gate the content on their site. Users answer up to two questions before the gate is lifted and their content is revealed; marketers have a new way to reach consumers via statistically significant surveys; and publishers gain an incremental revenue stream. Everyone wins!
Step 5: Pulling it All Together
Now it’s time to pull together all of your insights from the Visitors Flow reports, other Google Analytics reports, Qualaroo, Usertesting.com and Google Consumer Surveys to tell the collective story about why this homepage is underperforming and what must go into the challenging variation in order to crush the control.
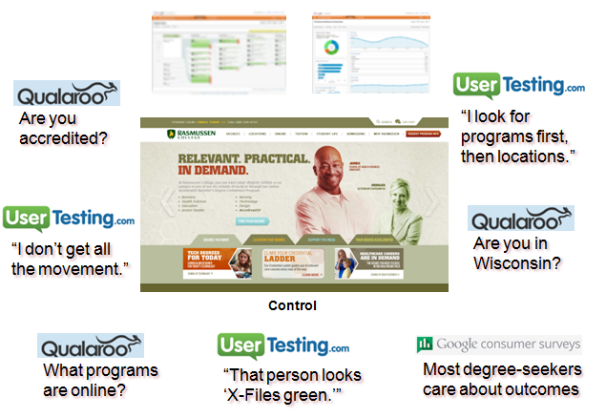
All of the insights for this test were compiled and reviewed by the entire team, at which point we prioritized which issues we wanted to address. Designers were then able to mock up a variation that embodied our best ideas on how to give visitors more of what they needed and less of what they didn’t want.

In the end, we ran this test with Conversion Factory‘s assistance using third-party CRO testing software Visual Website Optimizer. The challenger produced a 23 percent conversion rate lift over the control with 96 percent confidence. The Google Analytics Visitors Flow report was the first thread we pulled, and the visualization it produced eventually led to the unraveling of a poor homepage experience that resulted in low conversion rates.
Test Like a Big Data R&D Scientist
Conversion rate optimization (CRO) can be a double-edged sword. The freedom of being able to test anything can be either a powerful way to improve your marketing results or a fruitless flurry of subtle changes in button color, headlines and imagery, all fumbling about in hopes that something will yield a positive result.
Using the Google Analytics Visitors Flow report can make you feel like an R&D data scientist for the New York Times and is a sure-fire way to start CRO tests off on the right foot.
How do you use the Visitors Flow report? Is it counter-intuitive way to use GA or is it handy way to start your analyses? Do you send screen shots of it to your boss because of its eye-candy nature? How will you use it to start or improve your own CRO testing strategy?


