

Google Trends told me that Amazon Pokémon TCG was a breakout query while El Niño-related snow searches were also surging. The two looked connected: bad weather keeps people indoors, and card games are an indoor product. It was a tidy story. It also turned out to be wrong. How it fell apart is the more useful lesson than the trend itself. I went down the rabbit hole and pulled the initial data on September 8 and follow-up on September 16th 2026 with the region set to United States, time-frame as the past 24 hours and kept the category and search type unchanged.
The Claim
Off the bat, when I open Google Trends, I’ll find a list of trending topics. At this time, strong el nino snow map us was among the top search queries. Say my trending product is likely to fall in the same category.
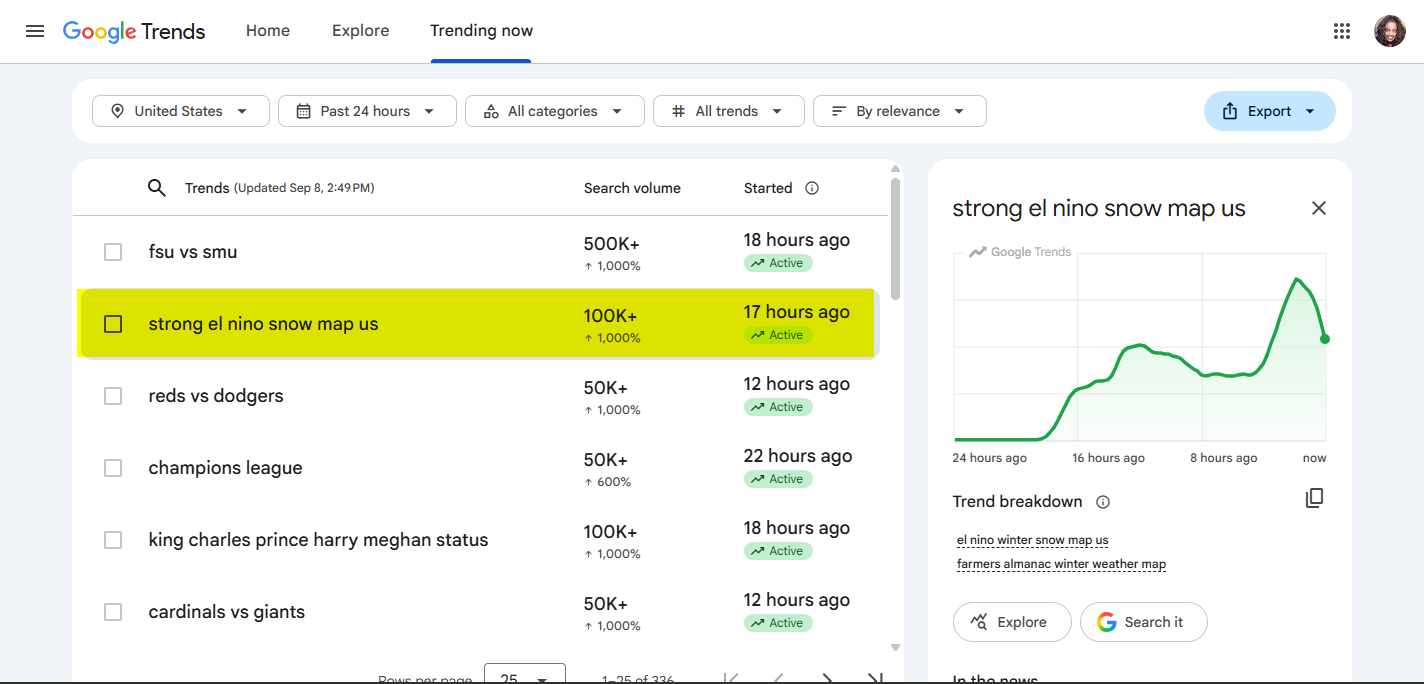
In this particular situation, that points to a card game; the Amazon Pokémon TCG. The predicted weather change provides a plausible explanation for why an indoor entertainment product might suddenly attract attention. Google Trends surfaced it as a breakout query. But a breakout label alone doesn’t tell you whether it’s worth betting inventory on.
How Easy It Is to Misread a Google Trends Spike
As a seller, your first assignment is to determine whether the trending product has enough staying power. Just how much are the searchers who could turn into potential buyers showing interest in this product? A short window plus a believable explanation is often enough to make a spike feel confirmed, even when nothing about it has been checked against history.
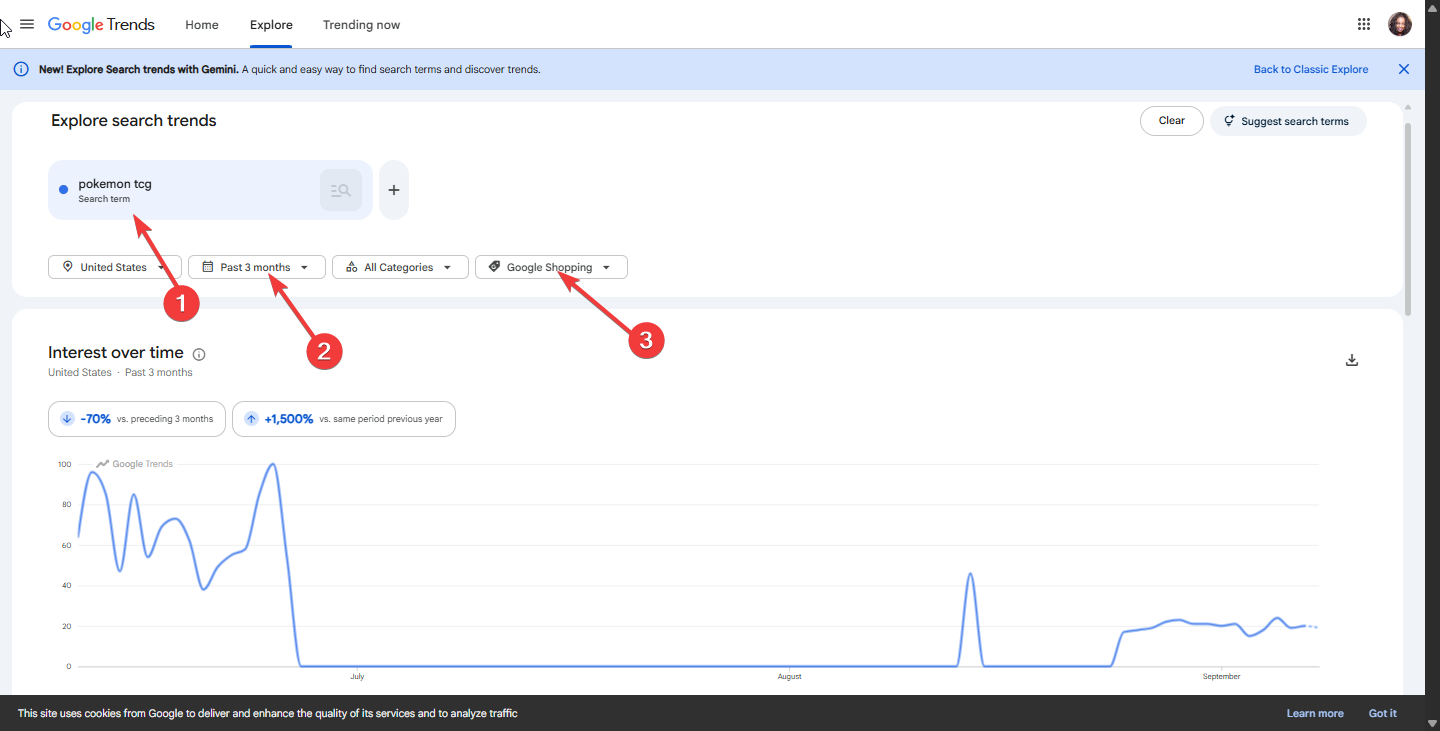
I put the claim to test and compared interest for the Amazon Pokemon TCG across four windows: past month, past 3 months, past year, and past 5 years. I also adjusted the search type to Google Shopping because I wanted to see if it would translate to a more commercially oriented search signal, or if they were just searching out of general curiosity. Differentiating general interest form intent-to-buy isolates true consumer demand from casual interest.
The short windows were convincing. The one-month view showed a sharp, clean spike. Impressive enough that makes it worth stocking inventory for. The three-month view still showed real activity. But the one-year view flattened into a near-flat line, and the five-year view showed no meaningful historical baseline.
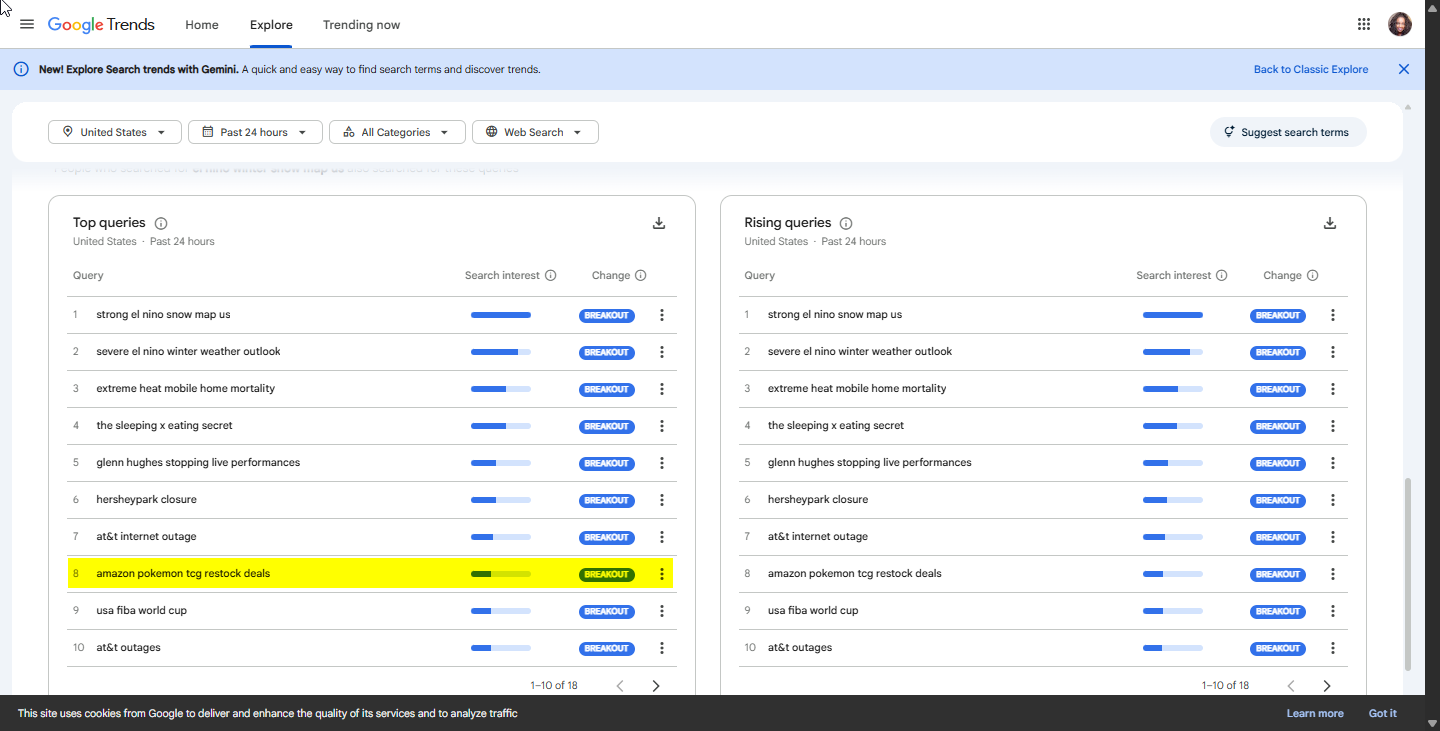
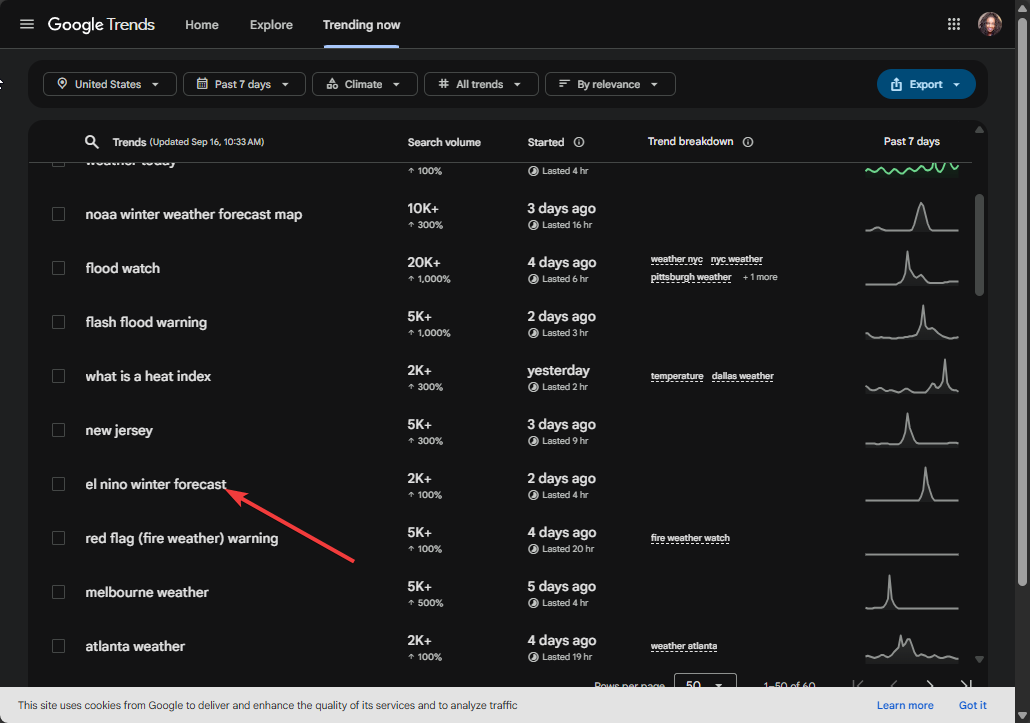
A week later, on September 16, I ran the same check. The weather query itself had already shifted from strong el nino snow map us to el nino winter forecast. The breakout query, Amazon Pokémon TCG had dropped out of the trending list entirely.
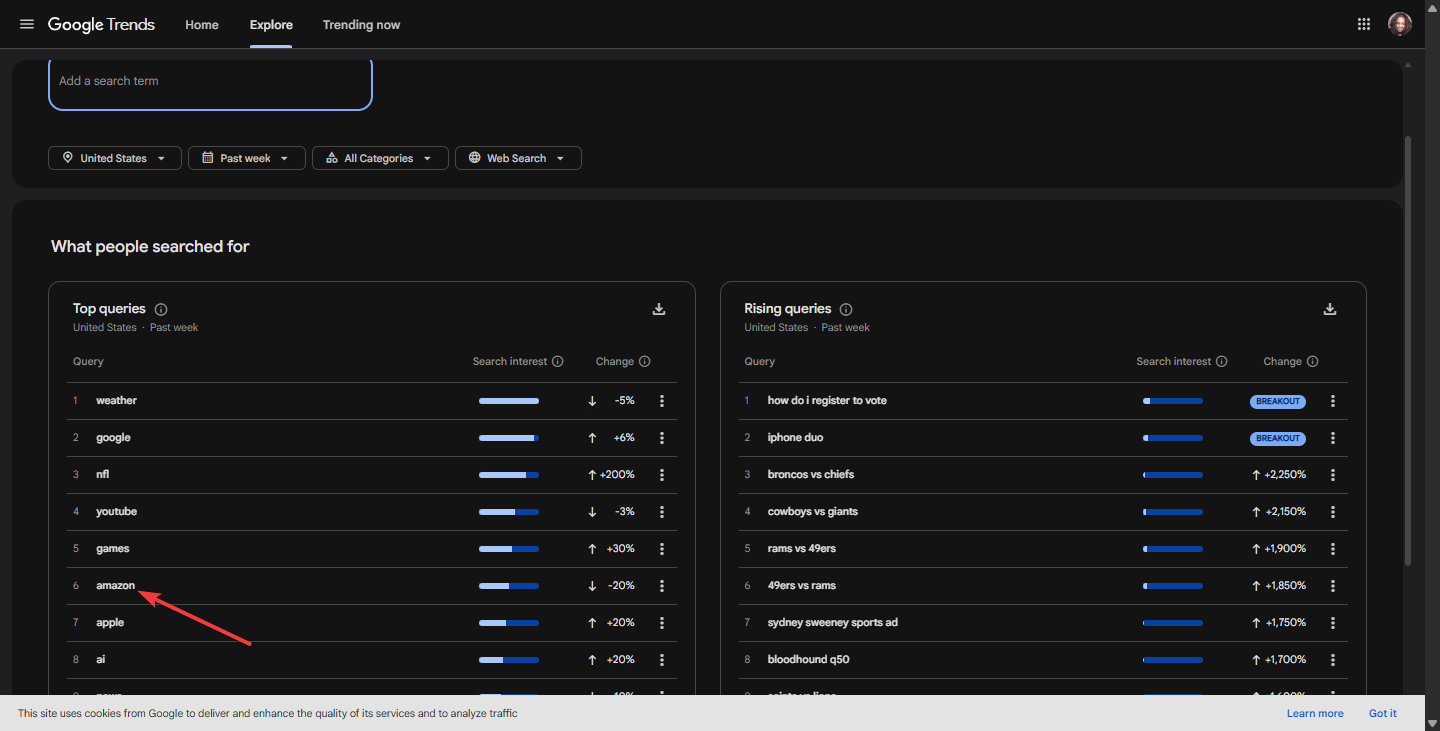
Amazon Pokemon TCG was not among the trending queries but Amazon was.
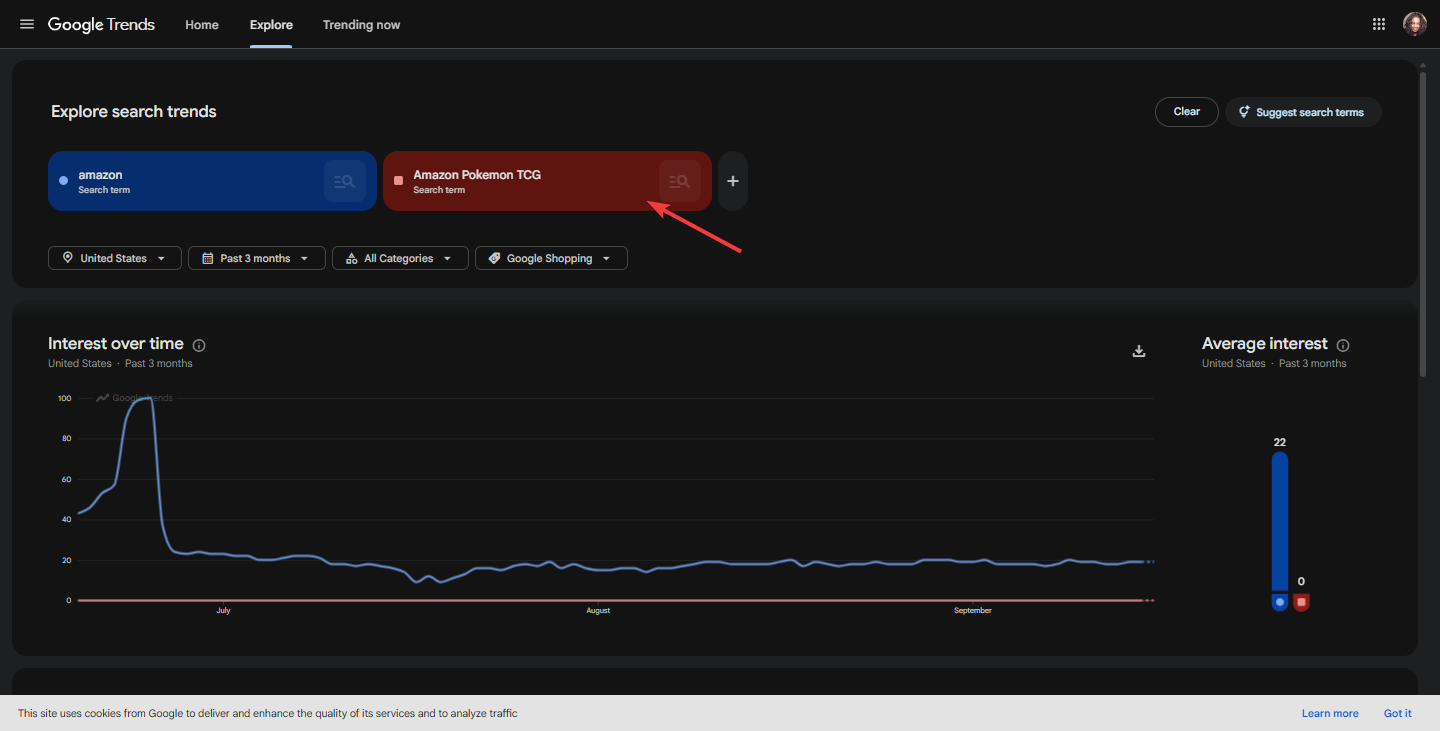
I went ahead to explore the search query with a small adjustment by adding the game to the search query alongside Amazon. It wasn’t among the breakout queries and upon further examination, its search interest had slowed down.
The three-month Shopping-filtered view showed a spike that peaked quickly and then flattened, rather than building into anything sustained.
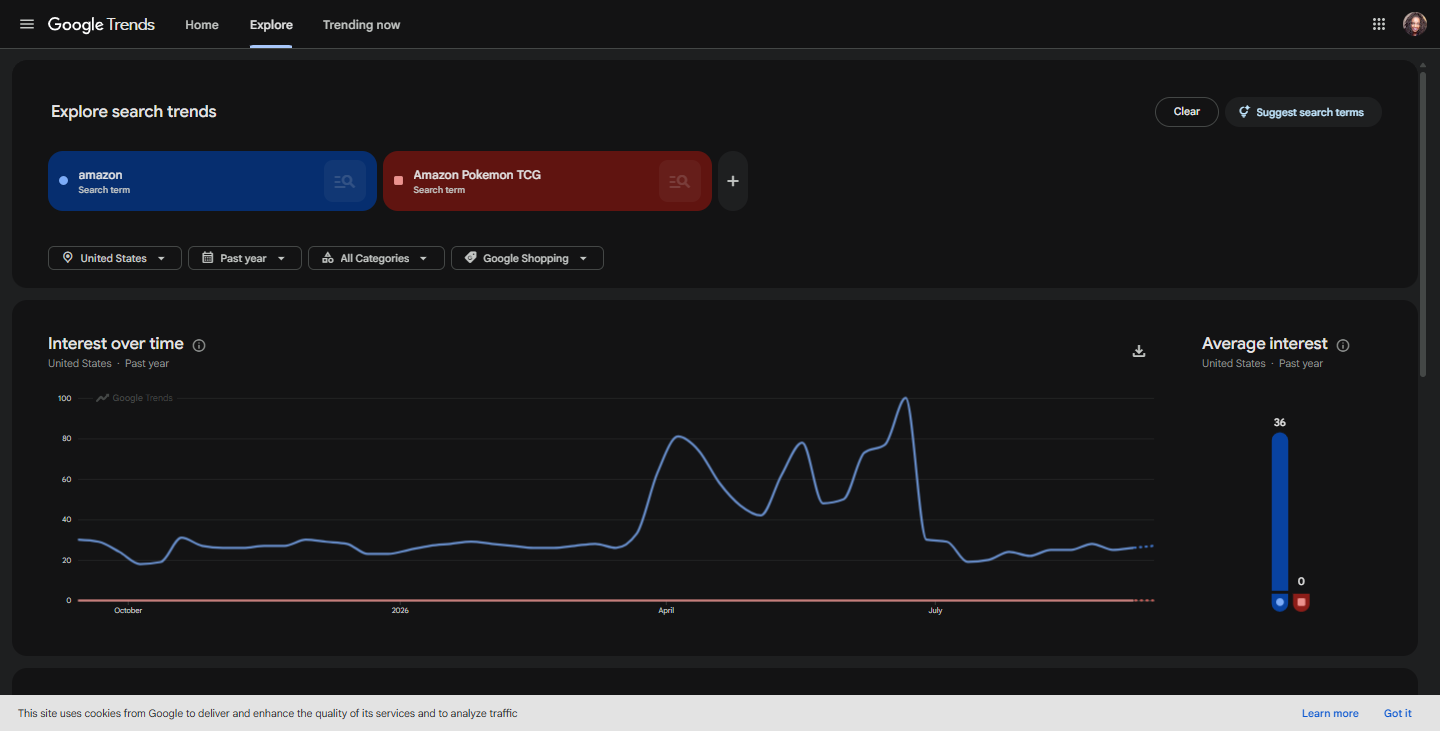
The one-year and five-year views still showed no baseline.
Where I was almost fooled
First off, Google Trends asn’t wrong. The breakout was real. The mistake would have been interpreting “breakout” as proof of a large and sustainable market. While it highlighted a breakout spike, it provided no data on overall market size, commercial intent, or whether the trend had real staying power.
On the 1-month view alone, the game looked like a clean, confident signal. The three-month view almost sealed the deal with some activity. Further, not only was it a breakout query, it had a plausible cause. The weather trend gave me a very convenient explanation for the Pokémon spike, and it became easy to build a story around the data. If I was a seller, I’d have stopped there. I would have read this as validated demand and moved straight to sourcing inventory.
This breakout query paints a different picture from a seasonal product. The trend would be predictable. If this were a genuine seasonal trend, I’d expect to see recurring peaks around the same period each year on the five-year view. That’s exactly why I went back a week later to see if this momentum would hold up and unfortunately, I couldn’t verify a recurring seasonal pattern. The follow-up confirmed the initial momentum had already fizzled out and the longer-term views did not show a meaningful historical baseline.
My Verdict
Based on the numbers, this claim didn’t hold up. The 1-month spike looked strong in isolation. However, a single unconfirmed spike with no five-year track record isn’t evidence of a genuine breakout query. More importantly, Google Trends does not provide absolute numbers or even the search volume. What you get access to is relative peak interest over a time frame. After all, it could be trending because it’s a new game or some controversy around it. I’m glad I waited it out to see how the search query transformed. I used the breakout query as a signal to investigate rather than a green light to buy inventory. My key takeaway is to look beyond the immediate breakout and check longer timeframes. You can avoid the costly trap of misreading search noise for real demand.
Start the conversation by posting the first comment