Google Analytics is a tool that can provide invaluable insights into what’s happening on your website, your levels of traffic and engagement, and the success of your campaigns.
However, to a newcomer to Google Analytics, the array of different reports available can seem a little overwhelming. Once you’ve got Google Analytics set up for your website, where do you look first? Where will you find the most useful data for your campaigns?
Reports on Google Analytics are broadly divided into two types. There are standard reports, which are the preset reports listed down the left-hand side of your dashboard, divided into the segments Real-Time, Audience, Acquisition, Behavior and Conversions.
The data that appears in these is predetermined by Google Analytics, but you also have the option to customize many of them, allowing you to use the standard reports as a base and then tweak them to your liking.
Then there are custom reports, which can either be created completely from scratch with whatever data you want to gather together in a single view, or created based on a standard report, with additional segments or filters added to tailor the report to your needs.
There are dozens of different standard reports available in Google Analytics, providing a wealth of insight into audience demographics, sources of traffic, content performance, campaign performance and much, much more.
In this series, we’re going to tackle the gargantuan task of explaining each segment of Google Analytics and the standard reports they contain. We’ll cover the data you can find within each standard report, and how it can be used in your marketing and SEO efforts.
First up are real-time reports. How do they work, and what kinds of campaigns are they useful for?
What are real-time reports?
As it says on the tin, the Real-Time Reports section in Google Analytics allows you to monitor activity on your site in real time, as it happens.
It can be a useful way of “taking the pulse” of your website in a specific moment, or tracking the response to a campaign in real-time. Just don’t get too obsessed with watching the numbers go up and down!
A visitor to your site qualifies for the real-time report if they have triggered an event, or pageview, within the last five minutes. This is different from the other types of standard report, where a session is defined by a 30-minute window.
The Real-Time Reports section is broken down into:
Overview
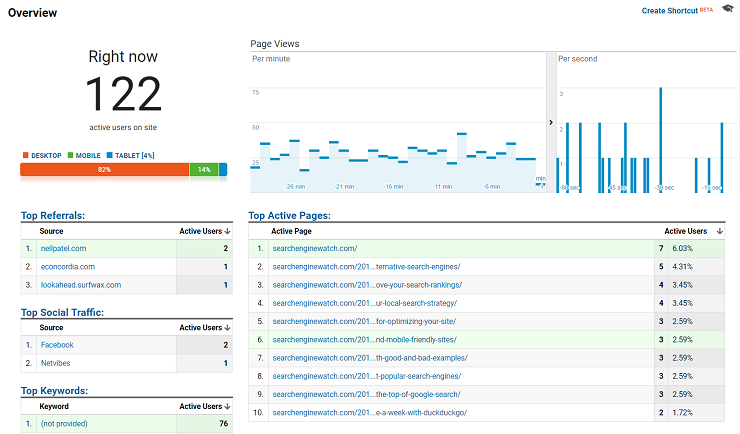
This is the big-picture view of what’s happening on your website at any given moment. The Real-Time Overview report shows how many users are currently active on your site, a list of the top active pages, top sources of referral traffic, top social traffic sources, the top locations that users are visiting from, and more.
Locations
This report drills deeper into the available data on where exactly in the world your users are accessing your website from.
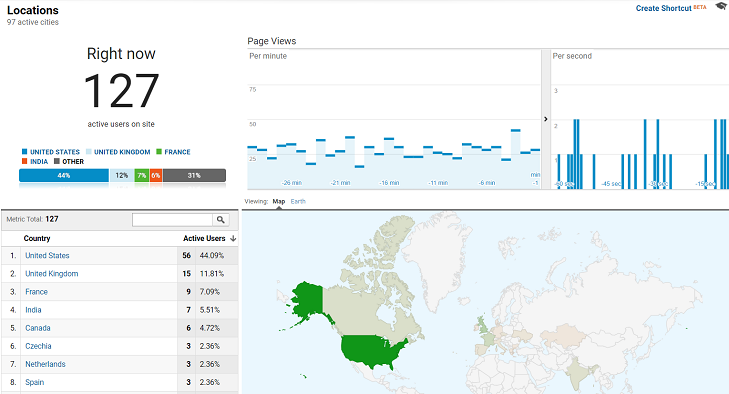
In the initial view, this information is broken down by country, but if you select a country name from the list or the map of active users, you can ‘zoom in’ on exactly which cities your users are logging in from. If you select a city from the list or map, you can get even more granular and filter the data by that specific city.
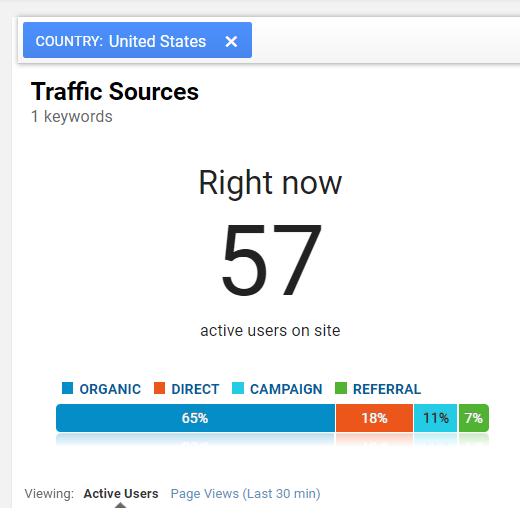
Note that if you apply a country or city filter and then navigate to another report in the section, such as Traffic Sources, the data presented to you will continue to be filtered by that region until you opt to clear the filters.

Real-time location data can be useful if you’re running a campaign targeted at a specific region of the world and want to monitor its performance, or if you want to get a sense of where your users are accessing your website from at different times of day.
Traffic Sources
As the name indicates, this real-time report shows where on the web your visitors are coming to your site from.
The data is organized by medium (how the visitors are getting to your site – organic search, direct traffic, via email, via social media, and so on), source (where visitors are coming to your site from), and the number of active users – or, if you select the Page Views filter, the number of pageviews from that traffic source in the last 30 minutes.
This real-time report can be useful if, for example, you’ve had a few different mentions in the press recently and want to gauge which one is generating more traffic to your site, or if you’re running a social campaign and want to assess how well it’s working.
Content/Screens
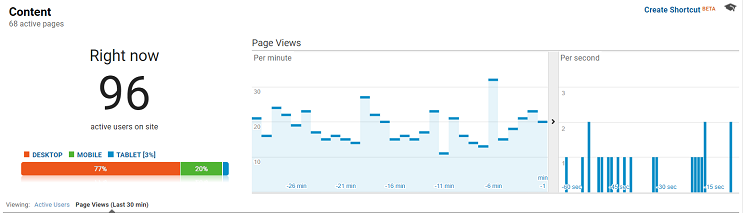
The Content report (called Screens if you’re viewing analytics for a mobile app) shows which specific pages of your site visitors are currently active on, showing the page URL, the page title, and the number and percentage of active users on that page. Again, you can switch to viewing this by pageviews (or screen views) in the last 30 minutes instead of by active users.
Another handy feature of the real-time Content report is that it breaks down your user data by device, so you can see which percentage of visitors are accessing your site on desktop, mobile, and tablet.
Events
This report is useful if you’ve used Google Analytics’ Events feature to create custom events for interactions on your site – such as button clicks, downloads, video plays, ad clicks, and so on. More detailed, non-real-time data on Events can be found in the Behavior section of your Google Analytics dashboard.
You can then use the real-time data from this report to track the top events on your site as they occur, or switch to viewing those activated in the past 30 minutes. Google sub-divides these into Event Categories and Event Actions, and as with the Content report, also shows you the breakdown of which devices your visitors are using when they trigger Events.
Conversions
The Conversions report will track the real-time completion of any Goals you’ve set up in Google Analytics.
Goals are different to Events in that they track the completion of an activity that contributes to the success of your business, rather than just an interaction with your site. This can include making a purchase, filling in a sales form, subscribing to a mailing list, and so on. More detailed, non-real-time data about Goal completions can be found in the Conversions section of GA.
As with the previous two reports, the Real-Time Conversions report breaks down which devices your visitors are using when they convert, and also allows you to view the data by active users or by Goal Hits in the last 30 minutes.
How can you use real-time reports in your campaigns?
Testing and troubleshooting campaign setup
One very handy quick use for real-time reports in Google Analytics is to test that everything is set up and working correctly. Unlike with non-real-time reports, there’s no wait for data to begin displaying, so you can immediately tell if things are in order, or if there’s an issue you need to troubleshoot.
Maybe you’ve just set up a new tracking feature in GA, such as a new Event or Goal, and you want to make sure you’re registering the form submissions properly. Or you might have created a new tracking link for your email marketing campaign, and you want to test that it’s showing up in the reports as expected.
You can test these out by having someone from your team carry out the Event or Goal that you want to track, or click the link in your campaign email, and then monitoring real-time reports to make sure that the activity shows up correctly.
Monitor campaigns unfolding in real-time
As we mentioned earlier, it’s not always a good idea to get too bogged down in watching the numbers on your site go up and down – often, the best insights from a campaign can be gleaned after the fact, as it’s not always clear what’s taking place in the moment.
However, there are some types of campaign that benefit from real-time monitoring and influencing. For example, say you’re running a social campaign, and you want to adjust your level of activity in real time based on audience interaction.
Real-time reports are the best way for you to monitor this, and will tell you useful things like when activity from a post or a tweet has dropped off (meaning it’s time to push out the next one), turn on paid promotion, or ask influencers to give your campaign a boost.
Capitalize on what’s trending
You may also need to react in the moment to something that isn’t part of a pre-planned campaign. For example, sudden activity on a specific piece of content or on one of your social channels might alert you to a big press hit, or that particular topic suddenly being in the news.
Checking up on real-time reports every so often can tip you off to when this is happening, and allow you to respond in an agile fashion. If it’s a trending piece of content, you could spotlight it on your front page, or knock out a quick update or refresh.
If it’s a big press hit, you can monitor where the traffic is coming to your website from and plan how to capitalize on the attention: are lots of people finding you on Facebook? Can you update your Facebook page or push out some paid social advertising? If people are searching for your brand all of a sudden, now might be a good time to check how you appear for those search terms and if necessary, do some on-the-spot reputation management.
How do you make use of real-time reports in Google Analytics? If you have any novel ways of integrating these into a marketing campaign, share them in the comments!
Leave a Reply
You must be logged in to post a comment.