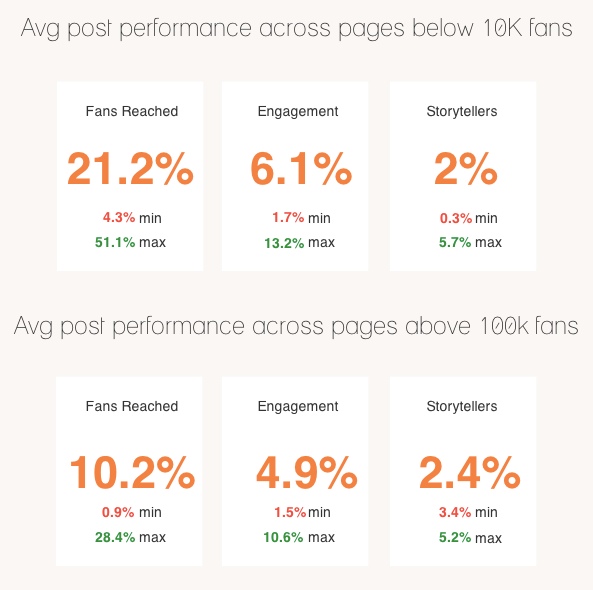
AgoraPulse has released its monthly “barometer” measuring Facebook page metrics across nearly 5,000 pages and 168 industries. The data for July showed the average engagement on posts for pages with less than 10,000 fans is 6.1 percent, while the average for pages that have 100,000 fans or more is 4.9 percent.

Looking at “storyteller” averages, this data is defined from the “talking about this” metric in Facebook. Facebook states “talking about this” is Facebook users who have created a story from a post by doing the following:
- Sharing, liking, or commenting on your post
- Answering a question
- Responding to an event
- Claiming an offer
The average percentage of storytellers for pages with less than 10,000 fans was 2 percent, according to AgoraPulse data. For pages with more than 100,000, the percentage grew 0.4 points to 2.4 percent.
So, how do name brands stack up against these metrics?
Statista released a graphic on August 19 that stated Coca-Cola was the most talked about brand on Facebook, according to real-time data that showed more than 1 million people talking about the company.
That number is down slightly as of today, but according to page averages by AgoraPulse, Coca-Cola’s storytelling metric is still below average for a fan base of that size.

Keeping in mind the average is showing at 2.4 percent, and looking at the number of people talking about Coca-Cola on Facebook on August 21 divided by the total number of fans, Coca-Cola’s storytelling comes in at about 1.4 percent. This is one percent less than the average.

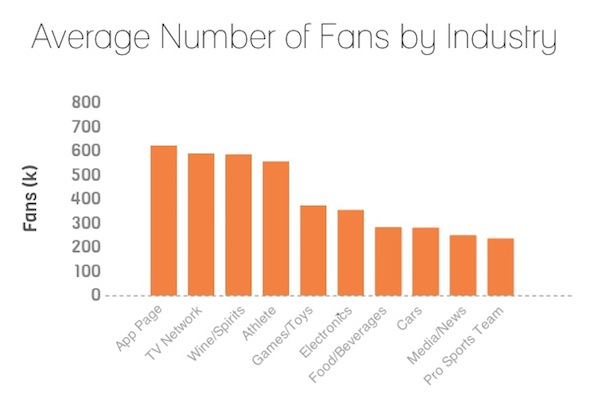
However, Coca-Cola far surpassed the average number of fans per industry, according to the research, which showed food and beverage garnering an average of 282,000 Facebook fans.

The NBA was also listed as one of the most talked about brands on Facebook by Statista on August 19. When compared to AgoraPulse data, it showed the average storytelling percentage for a sports website page was about 3.5 percent.

If the NBA fell into this category (note that it’s listed as “sports league” in Facebook and the AgoraPulse data has a category for “sports websites”), it would be down slightly from the average 3.5 percent “people talking about” metric at about 2.8 percent.

So big brand or small, when it comes to the data we’re seeing here, do your Facebook page metrics come in lower, higher or just about average? Please share in the comments if you’re up for it.
Here’s Statista’s full top 10 list of corporate brands, based on people talking about them:
- Coca-Cola
- Avon
- Walmart
- Disney
- Samsung Mobile
- Intel
- Bud Light
- Guarana Antarctica
- NBA
- Visa
To access AgoraPulse’s July 2013 Facebook stats in their entirety, go here.


