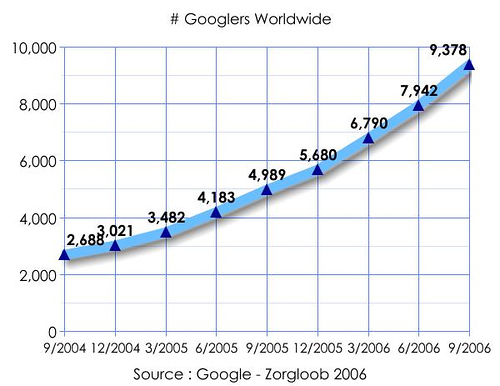
No problem – GeoFlow displays data in two other formats: Bubble Chart or Heatmap. Switching to either of these is as simple as changing the Chart Type in the Task Pane. GeoFlow is basically Excel charting plus Bing Maps on steroids.
Majestic has a nice little pie chart that shows you anchors and percentages so check whatever tool you're using and see if the data it gives you is sufficient for your purposes. Ahrefs has a nice little pie chart and they list out the numbers:
If you want a visual representation of similar types of data, you can use the chart tool to see just that – and in time, add yourself to the comparison to see how you are stacking up as your Internet marketing program takes off.
Do Online Video Advertisers Really Need Another Chart? YouTube's Ad Leaderboard joins the Mashable Global Ads Chart, which is powered by Unruly, and the Visible Measures Top 10 Viral Video Ad Campaigns Chart, which is published on Advertising Age.
Cut to August 2011, and Business Insider put out their infographic on Tips for Tipping Etiquette, which was an exceptionally well put together guide on tipping etiquette based on frequency and service offered, in an easy to read chart format.
Slaby used the chart below to demonstrate how owned, earned, and paid content have emerged as integrated activities. Influence is a powerful word, permanently ingrained into the digital landscape in which we live, work and play.
The number or users in the chart below highlights the potential audience reach you're missing when not advertising with Bing Ads and also helps to explain why advertisers often see increased ROI for campaigns in these industries.
As is evident from the chart below, social developed into a legitimate content discovery platform for online users. In the last 12-18 months, several factors have come together to form what could be described as a digital marketing perfect storm...
Some of the data used in Unruly Analytics also powers the Unruly Viral Video Chart, which has been used since 2006 by advertisers worldwide to track their video content. This new capability goes significantly beyond the useful information about how...
The chart below shows an example of a "bumpy" link acquisition profile and as in the example anything above the "normalized" line could be devalued. Unless you've had your head under a rock you've undoubtedly heard the rumblings of a coming Google...
To meet more prospects, we have decided to give the chart away online … almost. Let's assume we have created a cool chart that serves as a handy reference guide for our customers, and they love it. Are you surrounded by web developers and graphic...
The top right if the chart represents the highest ROI. People spend more time on the Internet than watching TV. What customers put in the search bar is the expression of intent”, said Seth Besmertnik, CEO of Conductor, and presenter at the SEO in...
Here's a helpful comparison chart to help marketers compare mobile app vendors. Recent Gartner research revealed that global mobile ad expenditure is forecast to be $11.4 billion in 2013, up from $9.8 billion in 2012.
This is not evident when looking at a chart such as Reach where, based on the x-axis, it appears to be showing daily values. Hover over any point in the chart, however, and you will see it is actually showing the total for the previous 7-day period.
The graph at the top also becomes useful in that you are now able to view a chart for performance for only a given section of a website. Since search quality indicators have become an increasingly important factor for search engines, evaluating SEO...
Details about the different kits, presented in a comparison chart helps the methodical consume more information. Turns out, you actually can.at least when it comes to your landing pages. In order to appeal to different buying modalities, you must...
And according to the Viral Video Chart powered by Unruly, The Budweiser Clydesdale commercial, Brotherhood, has basically “gone viral. Well, it often depends on which metric you use to measure the scores.
These data points are compelling, but the most striking one in the chart below is the percentage of online videos accessed by tablet and mobile phones, reaching 16 percent on a day with a major sporting event – a 100 percent increase compared to a...
Proprietary technology: The Unruly Viral Video Chart uses proprietary social tracking technology, which has been collating video sharing data for seven years and now stores data from over 300 billion video streams.
Continue creating this chart on a regular basis to see whether you’re becoming more or less relevant. I absolutely love this chart from ClickEquations, where you can see the impact of quality score on your Cost Per Click: