How to Double Your CTR with a Scientific AdWords Ad Copy A/B Test
How do you to conduct a scientific ad copy A/B test for AdWords and make sure that your test results are statistically significant?
How do you to conduct a scientific ad copy A/B test for AdWords and make sure that your test results are statistically significant?
When it comes to AdWords advertising, ad copy variations are one of the most important elements to constantly be testing, especially as you only have two or three seconds to differentiate yourself from the competition. In a short amount of time you can double your click-through rate (CTR) with only a handful of ad copy tests.
As anyone who manages AdWords campaigns knows, any time you boost your CTR your Quality Score (QS) will go up, your cost per click (CPC) will go down and your overall campaign profit will increase as long as the landing page conversion rate remains the same.
One thing to always keep in mind is that you need to make sure your ad copy tests are scientifically accurate so that the results you get will provide a lasting benefit.
The good news is that I’m going to walk you through exactly how to conduct a scientific ad copy A/B test for AdWords and how to make sure your test results are statistically significant.
Step #1: Update your ad serving optimization settings
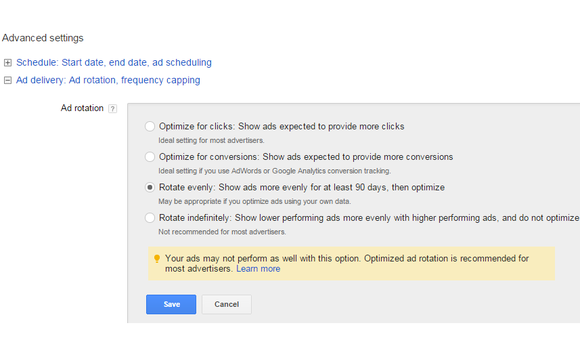
In order to get a true A/B test result your impressions need to be split evenly between your two ads. Fail to do this and Google may not even show your new ad if it thinks it will not outperform the winning ad.
Simply click on the campaign settings tab where the adgroup which you are going to be testing is located and change to “Rotate evenly” or “Rotate Indefinitely.”

Keep in mind that this is a Campaign-Level setting and will impact all adgroups in its container.
Step #2: Write some new ad copy variations
The second step is to write some new ad copy variations that are significantly different from the ad copy you’re currently using.
The reason you want it to be significantly different is because you want to find a new global maximum for CTR and conversions, not something that will create a small, difficult to measure improvement.
So make sure you test two or three new ad copy variations that are significantly different than the version you’re running, like an entirely new headline and ad copy combination, and not just slight change to the display URL.
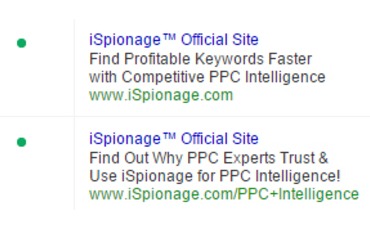
In the example below from iSpionage, the company where I work, you can see that we’re testing two completely different ad copy variations. The headline is the same, but the body copy conveys a different message in each ad. This means that relatively quickly we’ll know which version searchers like the most.

Step #3: Make a note of when you started the ad copy test
The next step is to run a scientific A/B ad copy test.
To do so, you first need to make a note of when you started running the new ad copy variation. If you started it on April 1st, for example, you’ll want to make a note of that somewhere you can easily find later. You can create a Google A/B testing spreadsheet to track these changes or within AdWords itself by utilizing “Labels”.

The reason for this is that you need to measure the results for the same time period for each ad. If one ad has been running for a month and one just starts running, they could have different results based on differing quality of traffic from month to month. Thus, you want to make sure you’re comparing the same time period by making a note of the start date so you can enter a custom time period in AdWords for more accurate measuring.

Step #4: Let it run until it’s statistically significant
The next step is to allow the ads to run until you get statistically significant results. This will take a longer period of time if the results are close and a shorter amount of time if the results for each ad are farther apart.
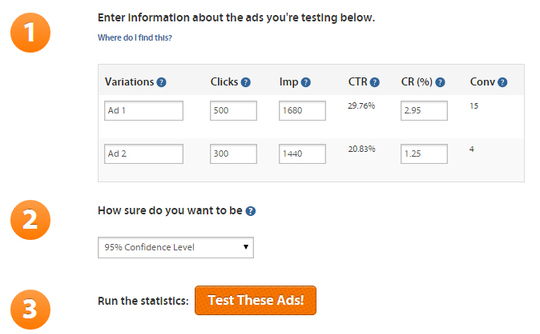
Cardinal Path has a very helpful tool for calculating A/B ad test results, which I highly recommend using. You simply add in the number of clicks for each ad, the number of impressions, the number of conversions, and the statistical significance level you’d like to measure (85 percent, 90 percent, or 95 percent) and the tool tells you whether or not the results are statistically significant.

Once you run the statistics, you’ll see results like the ones below.

What we see from these results is that ad 1 has a 42.86 percent higher CTR than ad 2 with a 95 percent chance that there is a true difference in CTR. However, the conversion rate analysis is inconclusive, which means more data is required to pick a winner from the conversion rate perspective.
What should you do at this point?
There are two things you can do at this point based on the results in the example.
The first option is to pick ad one as the winner based on its higher click-through rate, and then move on to test something else.
The second option is to let the ad run longer so you can more accurately discern which ad has not only the highest CTR but also the highest conversion rate.
That decision is completely up to you, but I’d personally pick ad one as the winner at this point and move on to test something else because I’d sleep easy at night knowing that the CTR is 42.86 percent higher and begin to test some other ways to boost the CTR even more.
At this point, you can also test either an entirely new ad copy or else a small change on the ad that you selected as a winner.
Let’s say you’re pretty happy with the results. In that case, you could tests slightly different headlines or else different display URL variations to see if one of those changes bumps your CTR up even higher. If you’re not super happy with the results, then you could test an entirely new variation to see if you can get another boost for your CTR.
The choice is completely up to you.
What really matters is that you use a PPC ad calculator tool to conduct a scientific A/B test so you don’t arbitrarily select a winner before the results are statistically significant. Sometimes it seems like one ad is performing better than another, but when you run the numbers, you realize that the results aren’t completely arbitrary and don’t yet represent an actual improvement. At that point, you’ll want to run your test a bit longer until you get significant results.
Over to You: Is there anything you’d add to this article or any other tools or tips you’d recommend? Leave a comment to let us know!
Homepage image via Shutterstock.