 A huge part of mastering Facebook Ads is mastering Facebook ads reporting and analysis, and being able to do so quickly.
Facebook users log on a lot and spend a significant amount of time each session, which means lots of ad impressions, translating to very big (impressions) numbers and very small (CTR) numbers for Facebook advertisers.
Here we explore the different types of Facebook reports to identify key data in a sea of numbers, what type(s) of ads each report is best used for, and Excel pivot table settings to create meaningful, beautiful reports fast.
Pivot Tables
The reports Facebook spits out are no fun to look at without formatting. A quick solution is using pivot tables in Excel.
After exporting reports from Facebook, highlight all of the raw data, then select Data in the menu bar to drop down, and then choose “Pivot Table” to open in a new tab. Pivot tables save advertisers time in reporting because to add new data as it populates simply copy and paste the new data in and refresh the table.
This post will illustrate pivot table settings for each report type.
Types of Facebook Reports
- Lifetime Report
- Advertising Performance
- Responder Demographics
- Actions by Impression Time*
- Inline Interactions*
- News Feed*
- Creative Analysis
(*denotes reports for Facebook-related ad units and sponsored stories such as Page Post Ads, Page Post Like Story, Page Like Story, Page Check-in Story, etc.)
Lifetime Report
Quickly access your Accounts stats (Advertising Performance) by campaign with Lifetime Report in a webpage format that can easily be exported to .csv. This is best used when a quick snapshot of high-level metrics are needed.

Advertising Performance
The advertising performance report is just that with typically data surrounding clicks, impressions, CPC, etc. Straight up, it’s what you need when reporting standard ad performance.
Advertising Performance Pivot Table Settings:
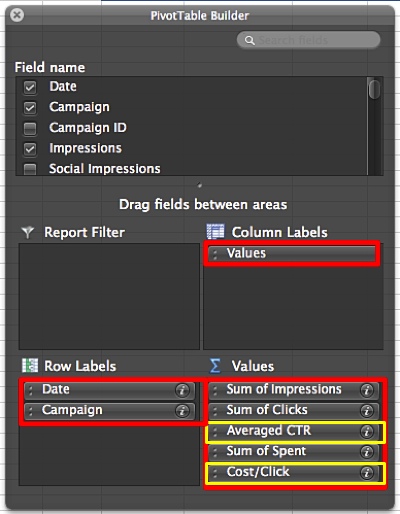
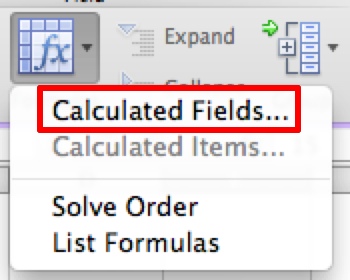
Note: do not simply select “CTR” or “CPC” and “average” as that Excel Function will average these metrics that are already an average. Instead, to get an accurate CTR or CPC in your pivot table select Formulas and Calculated Fields creating a manual CTR by clicks/impressions and manual CPC spend/clicks.
Responder Demographics
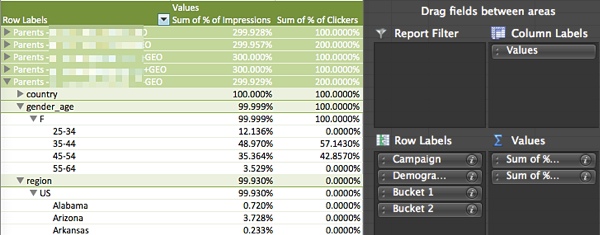
Want more data about who’s clicking on your ad? Check out the Responder Demographics report. This report breaks down age groups & geo of users clicking on your ads.
Use this report to: analyze your clickers & refine targeting. Do you see most clicks coming from only three geo areas? It may be an indication these spaces could be more profitable for your campaign.
Here’s an idea: duplicate the whole campaign (campaign A) using Power Editor. This will copy the campaign’s settings, ads, and targeting. So now you have campaign A and campaign A.2. In campaign A.2 adjust the geo targeting to focus on the geos where you’re getting the most response. This focuses your media spend to the most interested geos.
Pivot Table Settings:
Reports Specifically for “Paid Organic” Facebook Ads
The following reports are useful for advertisers using Page Post Ads, Page Like Ads, Page Like Stories, Page Post Stories, etc. – basically any Facebook Ad Unit that doesn’t go to a website other than Facebook.
Actions by Impression Time
Actions by Impression Time report will display the type (page like, post like, post comments, post shares) and number of actions taken for specific time periods (0-24 hours, 1-7 days, and 7-28 days) on any ads that interact with Facebook.
To get the most out of this report, summarize by ad:

This report is useful to analyze the “life” of promoted posts and when it would be most be advantageous to shut them off.

Actions by Impression Time Pivot Table Settings:

To be even more report-zealous, create CTR columns for each time period using the Calculated Fields feature mentioned above.
Inline Interactions
The Inline Interactions report is the “beefier” brother of Actions by Impression Time. This report breaks down which actions were taken, and includes social data.
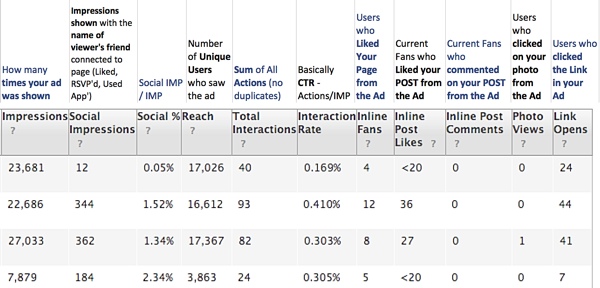
This report analyzes what types of posts get the most interaction, and what type of interactions. It’s also important to note here: when users click on the link in a post ad, “Link Opens,” they are taken directly to the post, not to the brand’s Facebook Page.

Inline Interactions Pivot Table Settings:
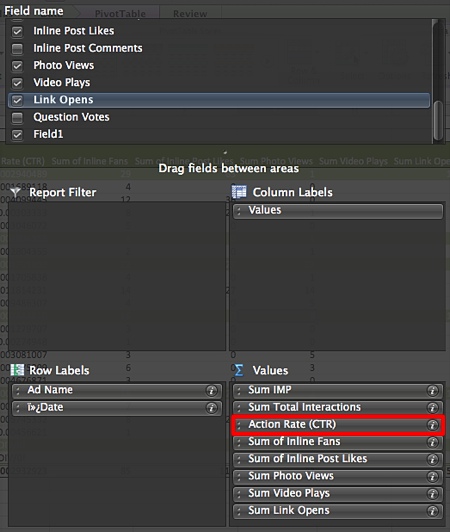
Create a calculated field again to calculate the CTR of Interactions.
News Feed
The News Feed report will provide data for ads that are placed in a user’s News Feed. Ads are placed in the News Feed of users targeted by the advertiser who are notPage fans or friends of fans. Use this report to analyze where you’re getting better CTR – fans and friends of fans or targeted non-fans?
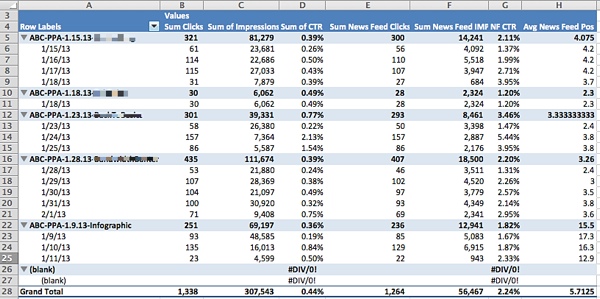
To clarify the “clicks” vs “news feed clicks:” clicks are the total sum of clicks on the ad, including “news feed clicks.”
News Feed Pivot Table Settings:
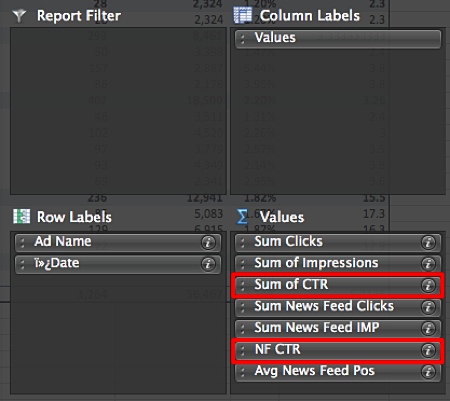
In this report, calculated fields have been created to calculate overall CTR and News Feed CTR.
Analyzing Creative
To analyze Facebook Ads at a creative level export an Advertising Performance report as a .csv or Excel at the ad level. Then, create a pivot table to analyze ad creative as aggregated across multiple campaigns.

Employ a strict ad naming convention to identify at-a-glance what marketing campaign the ad is for, the target market, headline, and image such as: [abbreviation of marketing initiative]-[segment name]+Ad Headline-[image description] such as: Branding-Media+The Bacon of Social-baconlogo. This also makes the text easy to break apart in Excel. Easily strip away the initiative and targeting prefixes using text to column under the data menu.
Creative Analysis Report Steps:
Once the report is open, insert a blank column to the right of the Ad Name column by right clicking at the top of column E & selecting insert then select all of column D (Ad Name):
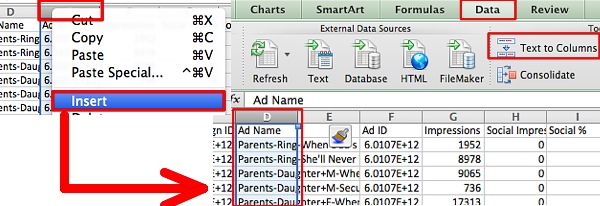
Next, delimit the cells by the “+” symbol that separates the prefixes:
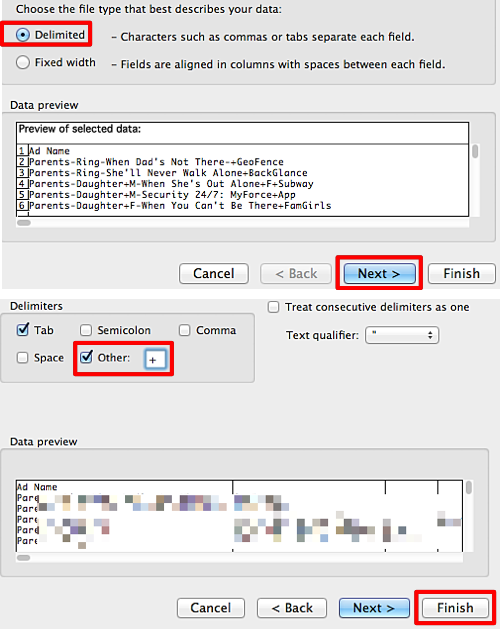
Copy and paste the ad names under column D (Ad Name) and remove the extra column. Finally, select all the data and create a pivot table.
Creative Analysis Pivot Table Settings:
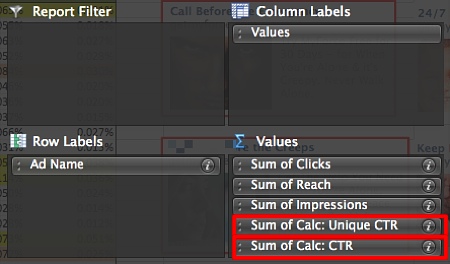
Facebook reporting can be quick and easy when reports are fully understood and pivot tables are built and in place to easily generate and add to reports.
Image credit: pasukaru76/Flickr
 A huge part of mastering Facebook Ads is mastering Facebook ads reporting and analysis, and being able to do so quickly.


