With the right data, could we predict the future and drive even better performance from our limited marketing budgets? Yes, I think so.
As digital marketers, we already understand “seasonality” directly impacts our marketing campaigns – it can drive more volume and higher ROI. But we aren’t always going deep enough.
For holiday campaigns, much has been done to break down consumer behavior into smaller, predictable and measureable events – Black Friday or Cyber Monday for example.
Why can’t we do this for other seasons like back to school or the summer travel season?
What I’m about share with you is an example of how to use data to build a well-timed campaign, specifically for back to school – but the implications extend well beyond this campaign type, retail, or search marketing.
Pieces of a Well-timed, Potentially Predictive Back-to-School Campaign
Start by combining two key ingredients:
- Predictable measureable “micro-event”: The first day of school (which is set by school district or state governments).
- Consumer behavior: Understand when parents begin shopping for their kids to go back to school.
By August 5, all of Hawaii’s 180,000 K-12 public school students will be back at school. But New York City’s 1.1 million K-12 students won’t be back at school until September 9. That’s a big difference in time, geography, and demographics.
Combine varying school start dates with insights like the fact nearly 72 percent of parents typically shop for their children within 1 week to 1 month before school starts – we now have our foundation.
Your Hawaiian advertising campaigns may need to start July 5th vs. August 9th for New York City. Of course, you could start advertising earlier for either Hawaii or NYC, but with limited resources it’s important to know when to focus (and not to focus).
When Parents Start Shopping for Back-to-School
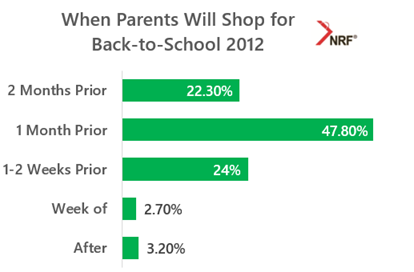
In 2012 the National Retail Federation (NRF) asked when parents planned to shop for the then upcoming school year. The survey is a great benchmark if you don’t have your own research or buying behavior. What does the survey say?
- Only 2.7 percent will shop the week of school and 3.2 percent will start after school has started (surprisingly not too many procrastinators!).
- The bulk of parents, nearly 72 percent, will shop for their children within 1 week to 1 month before school starts.

What are the implications for our digital marketing campaigns?
- Less Effective Ad Spend: If this data hold true, after the start of school, you’re “wasting” your money!
- Staggered Campaign Start: Now with start dates, we plan at least 1-2 months ahead. Two months for New York means, July 9, whereas it means June 5 for Hawaii.
When Do Kids Really Go Back-to-School?
The first day of school is determined by the school district, or state governments. There are nearly 120,000+ public schools and an estimated 15,000+ public school districts in the US – luckily, this data is already available for a fee from MCH Strategic Data. But if you increase the profitability of your campaigns by 5 percent, 10 percent, or more by making more intelligent decisions – would this data be valuable to you? I’d say yes.
If we plotted the number of students by their first day of school, it would be spread out over weeks.

It turns out, the first day of school can vary widely from district, city and state – this explains the different color bars above. Some states like Hawaii or Texas have a statewide uniform start date. Within states like California, major cities have different start dates – Los Angeles starts August 13, but San Diego starts September 3.
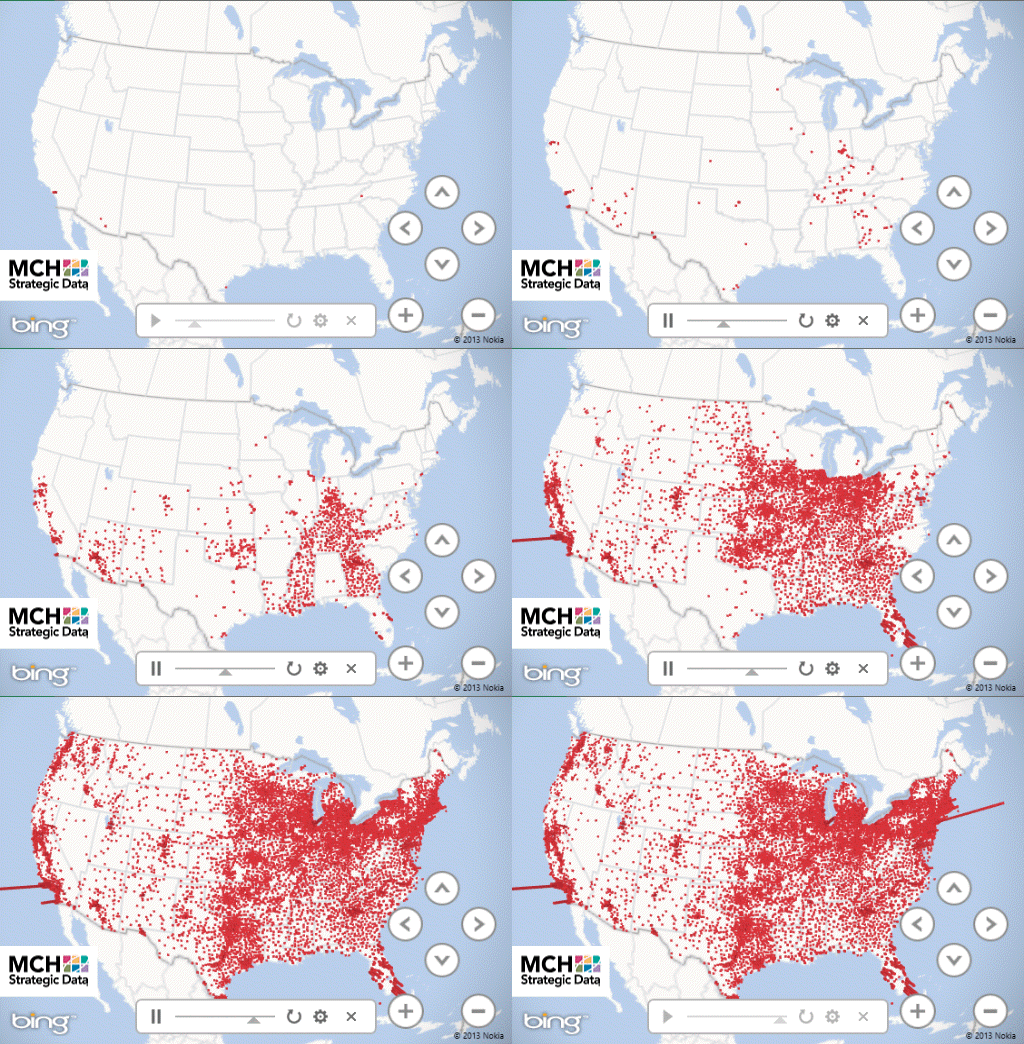
The image below shows how the first day of school varies across U.S. for the upcoming 2013 school year. The taller the column, the more students enrolled in the district, watch for the patterns.

Now Applying the Data to Your Campaigns, Starting with Bing Ads and AdWords
We can see distinct geographic patterns from MCH Strategic Data’s first day of school data. There are countless tactical combinations, but I wanted to list a handful:
- Break-out Campaigns by Geography. With the distinct patterns, customizing timing, ad copy and bids by geography may unlock better ROI.
- Stagger Campaign Start Dates. If parents are buying for their students within 2 months of the first day of school, you can focus your budget July 9 through September 9 in New York City.
- Stagger Campaign End Dates. According to the NRF Data less than 6 percent of parents will shop the week of school or after has started. That implies that you’d stop advertising back-to-school campaigns September 9 in NYC.
- Simple Set-up with Incremental Bidding. For a simpler campaign set-up, you can capture geographic peaks within incremental bidding within 1 nationally targeted campaign. Bing Ads has had geographical incremental bidding for years. And now with enhanced campaigns, most marketers are becoming increasingly aware of its potential. Soon within 1 campaign it will be possible to take a $1 bid for “trapper keeper”, increase bids for NYC by 110 percent to $2.10 and decrease bids in Hawaii by 90 percent to $0.10.
- Beyond Search: Facebook targeting or display network options could open up as well. Timing a Facebook campaign targeted to parents in NYC with elementary school aged children would definitely start later than Los Angeles or Atlanta parents.
There is opportunity to optimize for timing, and coordinate between all of your media buys. These are just a few ideas, but don’t limit your creativity.
That’s it: Think Ahead & Optimize Your Timing
You’ve already done all the work to build out a campaign, but optimizing your timing may take your campaign to the next level. These are insights I am sharing with large retailers right now and thought you might benefit from it. It starts with data.
As always, no idea is perfect so you need to validate any strategy with the truth of your own experience and business. There are a lot of moving parts, but hopefully it inspired you to think about your campaigns differently. Breaking down seasonality into small predictable and measureable “micro-events” may help you predict the future.
P.S.: You can apply this same concept and exact data set to map out school winter breaks or the last of school for family vacations.


