Slim Down Your CPCs With 3 Compound Metrics
Paid search is a lot like nutrition: there's an excess of data, but a big shortage in optimization. Here's how to reduce PPC data complexity and make profitable decisions.
Paid search is a lot like nutrition: there's an excess of data, but a big shortage in optimization. Here's how to reduce PPC data complexity and make profitable decisions.
I was at brunch with my friend Adrienne. She looked great. Not surprising, considering she lost 30 pounds. In fact, her own mother didn’t even recognize her!
Adrienne explained the ins-and-outs of nutrition: calories, carbs, fat, fiber… It was hard to process all of the data at the same time. I wanted to know one thing: which foods are most likely to help me get to my goal?
Simple, she explained, her program combined the nutrition info into one easy-to-understand compound metric: points. Every food has a point value, so you can easily pick between a turkey sandwich and a plate of pasta.
Paid search is a lot like nutrition: there’s an excess of data, but a big shortage in optimization. And like dieting, the complexity of the data leads to slow or, worse, inaccurate decisions.
You can reduce some of the complexity, and slim down your CPCs, with three useful compound metrics:
1. Profit Per Impression: Text Ad Testing’s Best Friend
Consider this text ad test of 3 ads. Let’s call them Ad 1, 2, and 3 from top to bottom.

Looking at the data this way raises some interesting optimization questions:
PPI is a great compound metric to help simplify text ad test analysis.
I owe a debt to Brad Geddes’ excellent article on this topic, “Profit by Impression: The real metric in PPC testing.”
2. Fine Tune Ad Groups with Weighted Ad Relevance
In his seminal video about bid management, Google’s chief economist Hal Varian introduced the concept of incremental cost-per-click: the amount you have to pay for the next click. The goal is to maximize our profit on the next marketing dollar.
There’s a parallel determining how we spend our next marketing hour:
Value of Incremental Optimization / Time Spent on Incremental Optimization = Incremental Value of Optimization
Prioritization is one of the challenges of paid search management. How do we determine which action is going to deliver the highest incremental value of optimization?
As in selling, we can approach the problem by considering fear of loss or hope of gain. Analyzing relative opportunity for improvement can often unearth obvious low cost/high return optimization.
Let’s use the example of search query mining.
As Craig Danuloff said, every search query is a question and each text ad is an answer. We want our text ads to be as relevant as possible to the search queries we target through our keyword/bid/match type combinations.
Our goal is to improve alignment by blocking irrelevant queries and tuning ads to match the intent behind the queries. The stronger the alignment, the greater the CTR, quality score and, usually, conversion rate.
Not every alignment exercise carries equal incremental value of optimization:
QueryMiner just released a useful Ad Relevance tool to address both of these problems.

I had them combine the individual ad relevance scores of each search query into a compound metric for the ad group called Weighted Ad Relevance:
You can score an ad group using a Weighted Ad Relevance score (about weighted metrics). First, add a Weighted Ad Relevance column = (AdRelevanceScore X Impressions). Then, put it in a pivot table & create a calculated metric = Weighted Ad Relevance / Impressions and aggregate to the ad group level.
The lower the Weighted Ad Relevance, the greater the potential Incremental Value of Optimization of the time you spend aligning search queries and text ads.
3. Impression Share Opportunity
Impression Share is one of the less documented and often poorly understood AdWords metrics. In short, it tells us what percentage of the times our ads were shown out of the total times it could have been shown.
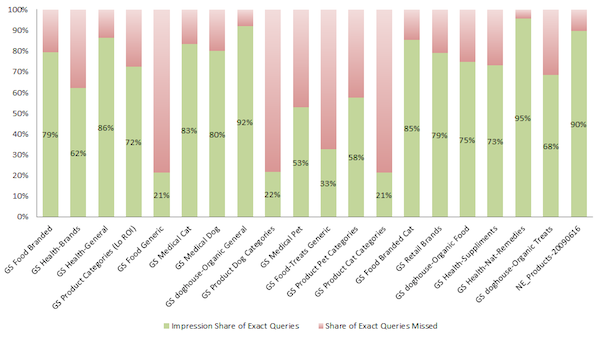
Three explanatory metrics help you understand why:
Exact match impression share is useful as a diagnostic tool, as it removes match type from the list of possible reasons for lost impressions.
Like Google’s bid simulator, Impression Share provides authoritative data about what could have been. Because we know how many impressions we got, we can calculate how many we missed:

We also know two important things about the impressions we got:
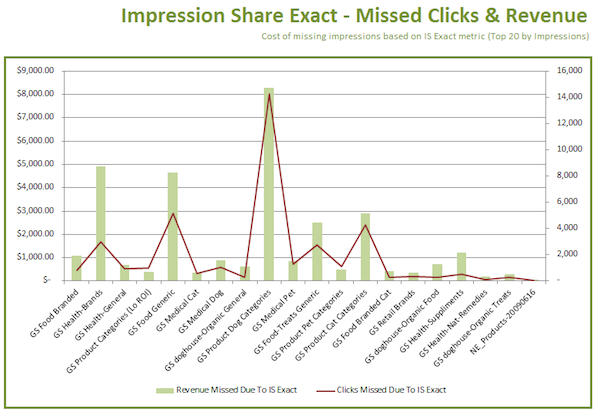
With this data, we can project an Impression Share Opportunity graph:

This chart shows the number of clicks and amount of revenue lost per campaign (and in total) based on the Impression Share Exact Metric. Calculations are based on the CTRs and revenue-per-click rates of these campaigns.
There are plenty of caveats for this kind of projection. In particular, the fact that all Impression Share data are reported on a campaign level and require good account structure to be meaningful. Assuming that, this data — like the volume estimates in keyword research tools — can be a useful indicator when comparing relative values among the campaigns.
With Impression Share Opportunity we can help more clearly establish the Incremental Value of Optimization for our campaigns.
3 Compound Metrics to Speed Your CPC Weight Loss
While I recommend compound metrics for comparison and prioritization purposes, they’re less valuable from a reporting standpoint and can get out of control. Read Avinash Kaushik’s contrarian view in “Actively Avoid Insights: 4 Useful KPI Measurement Techniques.”