How to Cut Through the Clutter in Branded Search
Introducing a methodology to measure true branded search volume -- one that is scalable and broadly applicable to virtually any brand.
Introducing a methodology to measure true branded search volume -- one that is scalable and broadly applicable to virtually any brand.
Not long ago, I chatted with a friend over some tacos. He’s a brand manager for a large food and beverage company, and found himself in a bind. The chief marketing officer viewed him as the digital guru, but when asked for an objective view on the brand’s overall performance in digital, a simple answer didn’t come easy.
I told him that one way of answering the question would be to look at the trend in search query volume for the brand name — if more people are querying keywords related to the brand name this month, compared to last month, that would be one way to answer the CMO’s question. This data is readily available from Google’s AdWords Keyword Tool.
But not all of the most popular queries are relevant to the product. Take a brand like Subway, for example:
As any digital marketer knows, search behavior is far too complex to rely on just one tool for insights on brand health. So I went to Nate Walton, one of our data analysts in New York, with a question: “Is there a way to automate the process of weeding out irrelevant, ‘off-brand’ terms from a long keyword list, to help our clients gain a reliable measure of the volume of search activity surrounding their brand?”
Before we knew it, we’d unearthed a methodology for measuring true branded search volume, one that is scalable and broadly applicable to virtually any brand. For this article, the brand we’ve chosen is financial giant J.P. Morgan Chase, the second largest bank in the United States. (Note: We’ve chosen to narrow our focus to Chase and not J.P. Morgan Chase, because Chase is the consumer brand with the lion’s share of search activity.)
Here’s how we did it:
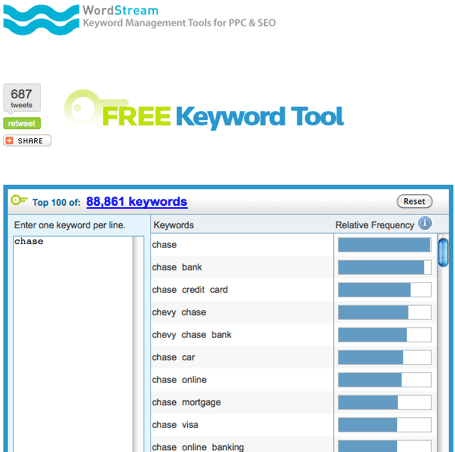
1. Generate as long a list of seed keywords as possible — any keywords containing the word “chase.” A variety of tools do this; we used Wordstream because it generates up to 10,000 suggestions, even in the free version.
2. Aggregate content from the brand’s website, creating a list of relevance keywords. These represent, as accurately as possible, what the brand is about. For this step, we used Website Content Analysis.

3. Paste the output from each into adjacent columns of an Excel spreadsheet. We then wrote a function to isolate only the seed keywords that match (at least in part) one of the relevance keywords.
4. The keywords that match become our branded keywords, and the rest are deemed off-brand keywords. We then re-applied Wordstream’s “relative frequency” metric for each group, and found that for Chase bank, the branded keywords’ overall share of total search queries is 34.3 percent (Note: this number is unique to Chase, and varies widely when applied to other brands).

5. Using this overall number of 34.3 percent, we go back to Google’s AdWords Keyword Tool and multiply it by the raw search query volume for “chase,” which was 30,400,000 in June 2010. The absolute number of branded search queries for Chase in June 2010 was 10,427,200.
What Do We Do With This Insight?
One metric means one thing today, but if we did this month after month, plotting the trend in branded keyword query volume versus marketing investments tells us a lot about seasonality, buying cycle, consumer intent, and more.
We could also apply the branded share metric to Google’s historical data, to project Chase’s branded search query volumes for the past, which would help us project forward. Wouldn’t that be helpful for a brand manager, to know when to strike while the iron is hot?
If we used this process on Bank of America, Citigroup, Wells Fargo, Morgan Stanley, and other competitors, we’d have a more accurate sense of how Chase stacks up.
And this is all just the search channel. Query volumes are just one of a vast array of digital marketing metrics used to gauge brand health. Conversion rate of display media, engagement with mobile ads, Facebook “Likes,” blog comments, even qualitative research findings from brand preference studies — these all provide a unique spin on the same core question: “How is our brand doing in digital?”
That ought to be easier to digest than tacos.

Leave a Reply
You must be logged in to post a comment.