Author
[email protected] [email protected]
Date published
February 24, 2010
Categories
In my earlier post about the impact of a Twitter wall on SES London, which caused our SES London content to trend on Twitter, i looked at whether infographic data could be useful. In this post, I have a first stab at visualising the data to assess the value of hashtags when blogging an event.
What follows is a breakdown of the performance of every blog post i managed to track at the time of formulation into a rankings index qualified by Bit.ly clicks. It’s not a competition, but a statistical analysis that seeks to tell a ‘story’ about the blogs who covered London SES 2010.
A note about the methodology used
All blog posts are measured by public data available via Bit.ly. Any URL shortened by Bit.ly can be analyzed for clicks simply by doing the following:
- If you know the URL, insert /info/ at the end of the domain and before the redirect code. Eg. the short URL for my previous post http://bit.ly/bsJKHX can be analyzed by re-writing it as http://bit.ly/info/bsJKHX
- If you dont know the URL, but it’s recently posted, simply shorten the URL you want to measure using their tool and see if an aggregate statistic shows up. It should say something like “0 clicks out of X”. If it does, simply view the info of the new URL you have created and then grab the aggregate short URL code to analyze using the method above.
Data collection disclaimer
- Bit.ly is not necessarily accurate and cant be tracked via Web Analytics very easily. The data below is not necessarily indicative of the traffic to the blogs and posts overall.
- The data is naturally skewed to posts that were measurable by Bit.ly. If the link to the blog post was not shortened via bit.ly then it would not be included in the chart. This means that whoever blogs is most likely to be top of the charts but that is deliberate and a fair measurement if you take it into account.
- These statistics do not reflect the quality of content on the blog in any way. It is simply a proof of concept of how you can calculate the relative performance of blogs that post against certain hashtags.
Single post with most clicks from Bit.ly – SEOptimise
Top 10 SES London Day One Tips from Twitter!
Blog with most clicks from Bit.ly – Microsoft adCenter

Most (Re)Tweeted posts – SEO Chicks

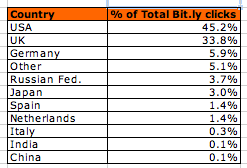
Most popular post by region according to Bit.ly clicks (ranked in descending order of % share of clicks)
Top 20 blog posts about SES London; ranked in descending order according to % share of Bit.ly clicks
- SEOptimise 10.2% Top 10 SES London Day One Tips from Twitter!
- Microsoft AdCenter 9.0% 21 Secrets from Bryan Eisenberg’s Keynote – SES London 2010
- SEO Chicks 5.9% SESLondon: Be Awesome! Ideas for Approaching Search Analytics Differently – Avinash Kaushik
- Freshegg 5.5.% Avinash Kaushik Keynote Speech at SES London 2010: A Recap
- SEO Chicks 5.2% SES London: Social Media 101, Lisa Myers
- State of Search 5.1% SES 2010 – Day 2- Brian Eisenberg – 21 secrets of top converting websites
- SEOptimise 4.1% What happens to London SEOs when you remix their drinks?
- Malcolm Coles 4.1% SES London: the ultimate list of blogs about it
- Fiona Cullinan 3.2% A dozen Twitter tips for 2010
- SEO Chicks 3.2% SES London KEYNOTE:SEO Where to Next?
- SEO Chicks 3.2% SES London 2010: Liveblog Schedule
- Microsoft AdCenter 3.1% Quoting Jim Sterne at SES London 2010
- Microsoft AdCenter 2.8% Social Media 101 with Lisa Myers – SES London 2010
- Web Certain 2.7% SES London Global SEO:Domains, Hosting and Geo-targeting #SES
- Freshegg 2.4% Real Time Search: SES London 2010 Recap
- Microsoft AdCenter 2.3% Introduction to SEO – Tips from SES London 2010
- Andrew Girdwood 2.1% Real-Time SEO: Newspapers come to SES London (#seslondon)
- Microsoft AdCenter 2.0% Analytics Geeks Ahoy! – SES London 2010
- SEO Japan 1.9% SES London 2010 : 最後に総括・・・地味ながら進化し続けるサーチ。乗り遅れず未来を体感、いや築いていこう。
- Bijgespijkerd 1.9% Internetmarketing tips vanuit SES London: Bryan Eisenberg
- SESLondon Day 2 KEYNOTE: Bryan Eisenberg – 21 Secrets of Top Converting Websites
- Search Engine Strategies 2010 – Day 1
- PPC vs SEO Showdown: SES London 2010 Recap
- SES London 2010 Video – Day 2
- Verslag SES London: Avinash Kaushik
- Beyond Ten Blue Links – Bing at SES London 2010
- Travel, Recruitment, Gambling & Retail SEO Strategies: SES London 2010 Recap
- Overview of the Ultimate Search Marketing Battle – PPC vs SEO
- Interviews with SES Speakers Andy Atkins-Kruger, John Marshall, Matthew Wood and Erica Schmidt
- SES London: Inspiratie voor Social & Search
- SES Day 2 Session 2 – Digital Assets Optimisation
- SES London PANEL: Social Media & the Marketing Mix
- Search Advertising Tools – SES London 2010
- Reflections on Bryan Eisenberg’s keynote at Search Engine Strategies, London, 2010 (#seslondon)
- SES London 2010 : コンバージョンとユーザビリティを向上するLPOのベストプラクティス
- International SEO: SES London 2010 Recap
- SES London 2010: Blog Post Round Up
- Developing Great Content – SES London 2010
- Is Social Media A Fad?
- State of the UK Search Industry: SES London 2010 Recap
- Visualizing Anchor Text
- SES London 2010 : SEOの未来はどこへ?
- http://www.seojapan.com/blog/ses-londo-2010-ソーシャルメディアの効果測定方法
Key insights

The most interesting thing that emerged for me, aside from the fact that Keynotes & sessions are the most popular content, was that there was also significant value in blogging about the event itself, rather than simply the content of the session and keynotes. Posts about what bloggers planned to write about, off topic insights during the conference and compilations of all the posts they found made up over 20% of the total traffic. This suggests to me that demand for content is high and buzz really is infectious – people who cannot attend may well be getting as close as they can via the bloggers.
Finally, here is a stats sheet of all the posts and ranked in order of popularity within their own blog. I simply included it to show the full data set – do with it what you will 🙂
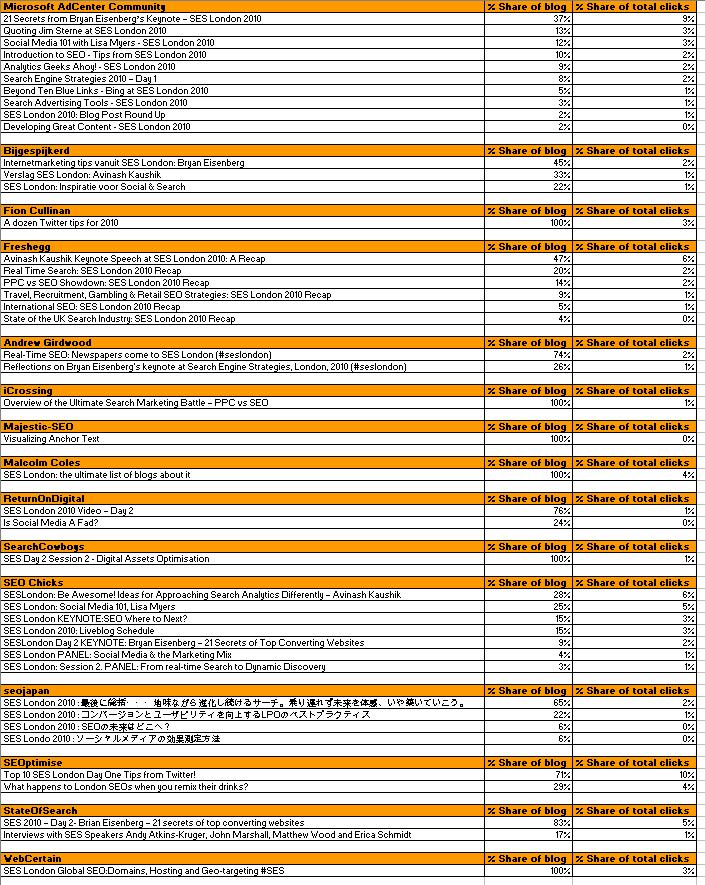
Please do drop your thoughts on this experiment in the comments below.