Panda Update (UK): Who Got Two Black Eyes From Google? [Infographic]
Google UK's Panda update shook a lot of website categories in it's search for 'high quality' content.
Google UK's Panda update shook a lot of website categories in it's search for 'high quality' content.
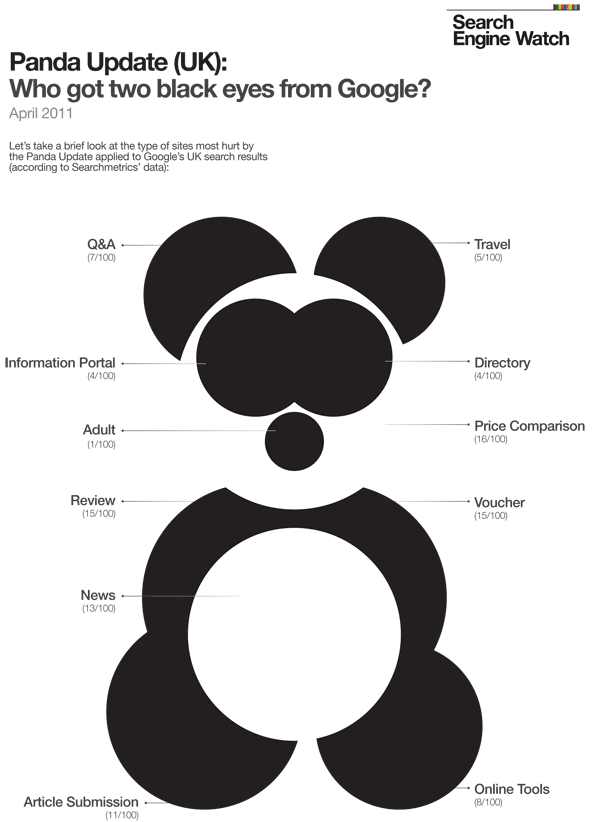
Google UK’s Panda update shook a lot of website categories in it’s search for ‘high quality’ content. We were interested to know what kind of sites saw the biggest ‘visibility’ drops so we categorized the data of the top 100 sites that lost search positions according to data released by SearchMetrics.
The panda update was one of the first algorithm updates to actively survey ‘real people’ and use their input and quality assessment to benchmark it’s algorithm.
Whilst the data visualization below is not an indicator of any traffic reduction to those sites (many are upbeat and defiant about the impact of the panda update on their business), it is a useful indicator of where Google’s latest algorithm has focussed it’s efforts.
Feel free to use this infographic on your own blog! This data was visualized for Search Engine Watch (SEW) by Neil Tweddle from Typo-Graphic. You can download the full data visualization here: SEW PANDA UK.pdf
More about:
The Merkle B2B 2023 Superpowers Index outlines what drives competitive advantage within the business culture and subcultures that are critical to success. It is the indispensable guide for B2B marketers to deliver world-class experiences and keep pace with the dynamic environment. Download Now
The ClicData survey found that various challenges exist that prevent organizations from achieving such gains. These challenges included inaccessible data formats and limited flexibility in displaying data in dashboards. Download Now
The need for fraud prevention in the digital world is critical now more than ever. Why? Thinking about your own behavior, consider how you complete transactions and how this has changed over the last 5 years. Download Now
The need for fraud prevention in the digital world is critical now more than ever. Why? Thinking about your own behavior, consider how you complete transactions and how this has changed over the last 5 years. Download Now
Leave a Reply
You must be logged in to post a comment.